
Extended data figure 4. Distinct epigenetic features of Kdm6b- and Kdm4d-affected Ps-DHSs, related to Figure 2.
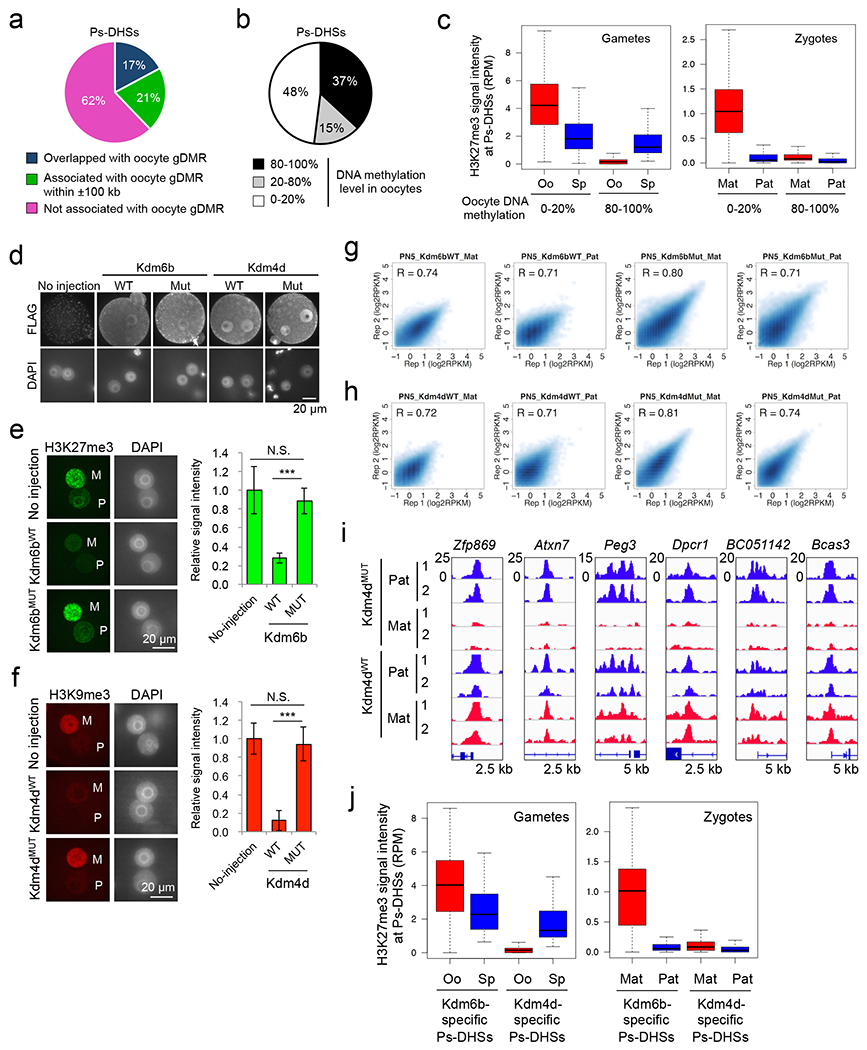
a, Pie chart showing percentages of Ps-DHSs that overlap (black) or associated (gray) with oocyte- gDMRs within ±100 kb. Oocyte gDMR was defined by >80% methylation in oocytes and <20% methylation in sperm.
b, Pie chart showing the percentages of Ps-DHSs organized based on their oocyte DNA methylation levels.
c, Boxplots showing the H3K27me3 signal levels at Ps-DHSs ±1 kb in gametes (left panel) and zygotes (right panel). Ps-DHSs were divided into oocyte DNA hypomethylated (0-20%, n=296) and hypermethylated groups (80-100%, n=305). Middle lines in the boxes represent the medians. Box edges and whiskers indicate the 25th/75th and 2.5th/ 97.5th percentiles, respectively.
d, Representative images of Kdm6b- or Kdm4d-injected zygotes stained with anti-Flag antibody, using non-injected zygotes as negative controls.
e, Representative images of zygotes stained with anti-H3K27me3 antibody. M, maternal pronucleus. P, paternal pronucleus. The bar graph on the right represents relative immunostaining signal intensity of maternal pronuclei. The averaged signal of non-injected zygotes was set as 1.0. The total numbers of embryos examined were 8 (No injection), 13 (Kdm6bWT), and 10 (Kdm6bMUT). Error bars indicate SD. ***, p<0.001 (two-tailed Student t-test). N.S, statistically not significant.
f, Representative images of zygotes stained with anti-H3K9me3 antibody. The bar graph on right represents relative immunostaining signal intensity in the maternal pronuclei. The averaged signal of non-injected zygotes was set as 1.0. The total numbers of embryos examined were 5 (no-inject), 5 (Kdm4dWT), and 7 (Kdm4dMUT). Error bars indicate SD. ***, p<0.001 (two-tailed Student t-test). N.S, statistically not significant.
g, Scatter plot showing the correlation between biological duplicates of liDNase-seq for maternal (Mat) and paternal pronuclei (Pat) of Kdm6bWT- and Kdm6bMUT-injected zygotes.
h, Scatter plot showing the correlation between biological duplicates of liDNase-seq for maternal (Mat) and paternal pronuclei (Pat) of Kdm4dWT- and Kdm4dMUT-injected zygotes.
i, Genome browser view of representative Ps-DHSs affected by Kdm4dWT.
j, Boxplot showing H3K27me3 signals at Kdm6b- or Kdm4d-affected Ps-DHSs ±1 kb in gametes (left panel) and zygotes (right panel). Middle lines in the boxes indicate the medians. Box edges and whiskers indicate the 25th/75th and 2.5th/ 97.5th percentiles, respectively.