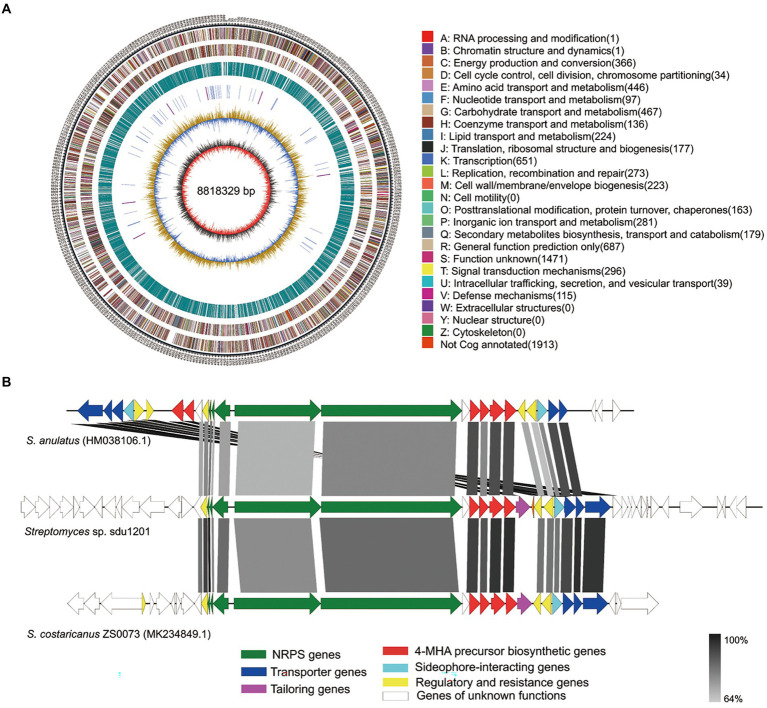
Figure 5.
Complete genome and actinomycin D BGC of Streptomyces sp. sdu1201. (A) Circular map of genome. The seven circles (outer to inner) represent forward genome size, strand coding sequences, reverse-strand coding sequences, repetitive sequences, transfer RNA (blue) and ribosomal RNA (purple), GC content, and GC skew. (B) Comparison of actinomycin D BGC from Streptomyces sp. sdu1201 (middle) with reference actinomycin D BGC from S. anulatus (top) and S. costaricanus ZS0073 (bottom).

