
Fig. 2. MTCH2 is required for mitochondrial outer membrane protein biogenesis.
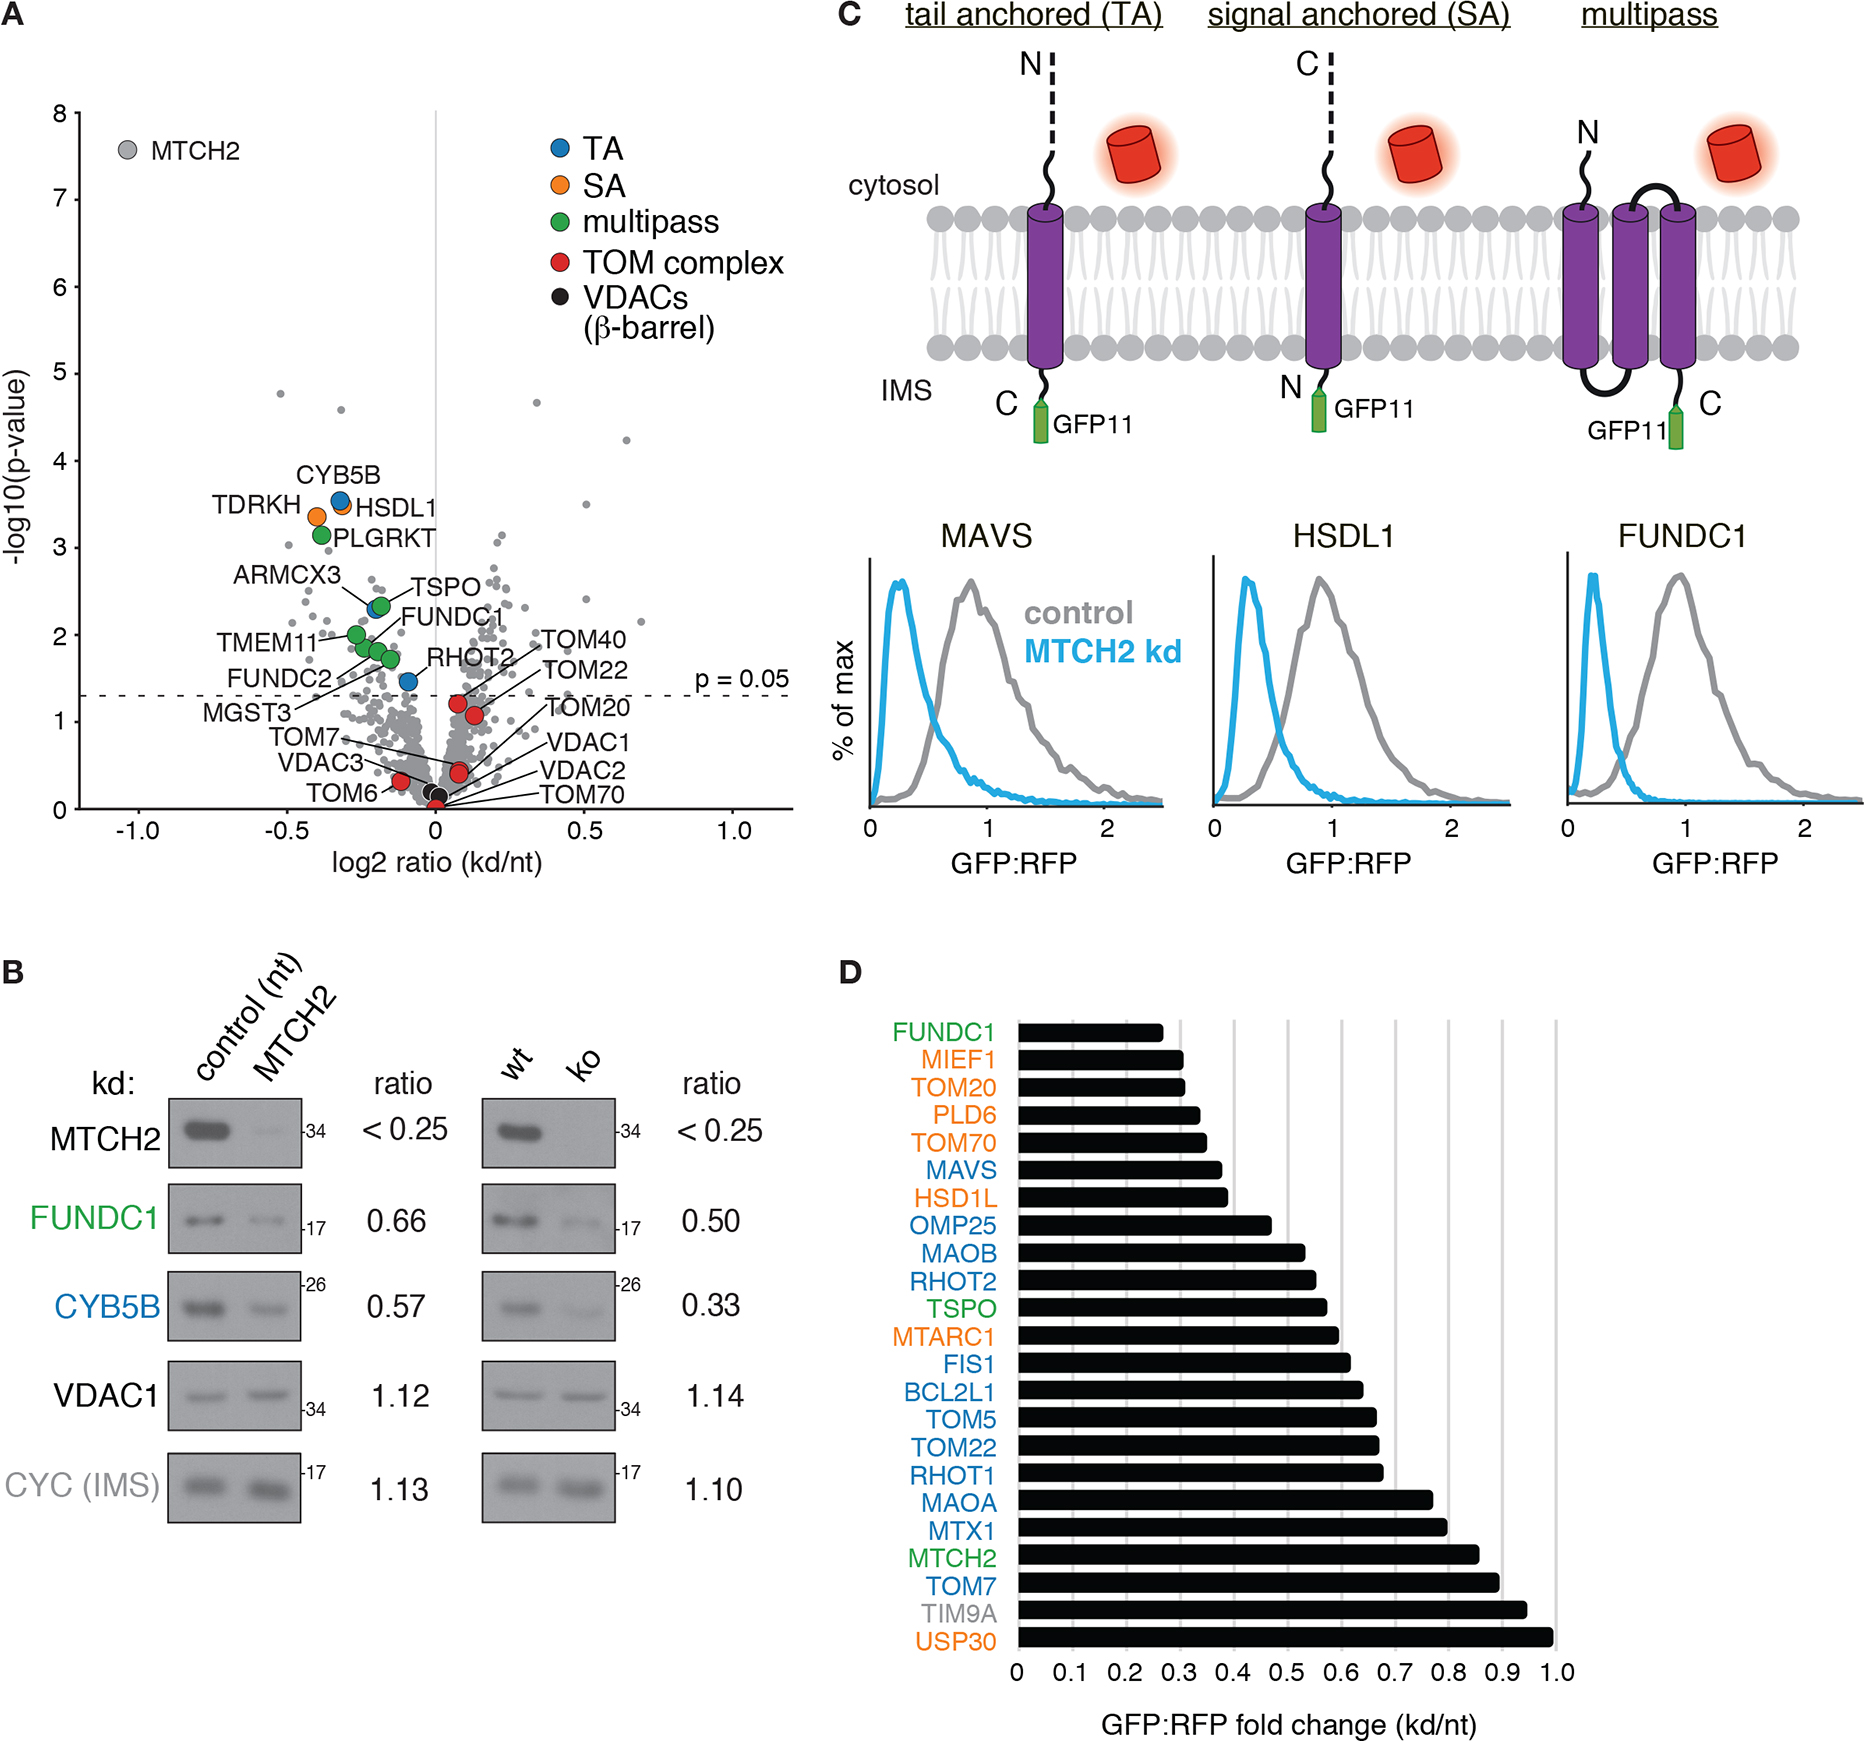
(A) Label-free mass spectrometry analysis of purified mitochondria isolated from K562 cells using a percoll gradient (fig. S1B) expressing a MTCH2 targeting sgRNA (kd) compared to a non-targeting control (nt). Displayed are proteins that across four biological replicates were statistically altered in MTCH2 depleted versus non-targeting guide expressing cells colored according to the indicated key (signal anchored: SA). (B) Immunoblotting of endogenous proteins in mitochondria isolated from MTCH2 depleted (kd) and control cells in (generated as in A; left), and wild type (wt) and MTCH2 knock out (ko) cells (right). Substrates are colored by topology based on the key shown in (A). Quantification of fold-change in depleted vs control cells is displayed as determined using a dilution series for each antibody. (C) Flow cytometry analysis of integration of outer membrane protein reporters using the split GFP system described in Fig. 1B. GFP fluorescence relative to an RFP expression control are displayed as histograms in MTCH2 knockdown versus non-targeting K562 CRISPRi cells. Displayed are representative examples of a TA, signal anchored (SA), and multipass membrane protein that have a MTCH2 dependent biogenesis defect. (D) Summary of dependence on MTCH2 for the indicated outer membrane substrates determined using the fluorescent reporter system shown in (C) and colored by topology based on the key in (A).