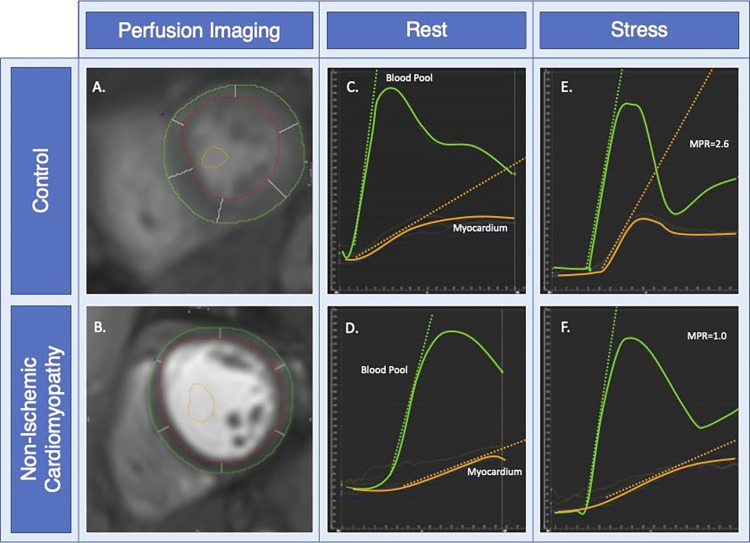
Fig 1. Determining myocardial perfusion reserve index.
Panel A, B: First pass perfusion images with endocardial, epicardial, and blood pool contours. Panel C-F: Time intensity curve graphs at rest (C, D) and stress (E, F) first pass perfusion with maximal upslopes of blood pool (orange line) and myocardium (blue line). MPRI is calculated as the ratio of RUstress/RUrest where RU is ratio of maximal upslope of myocardium divided by blood pool.

