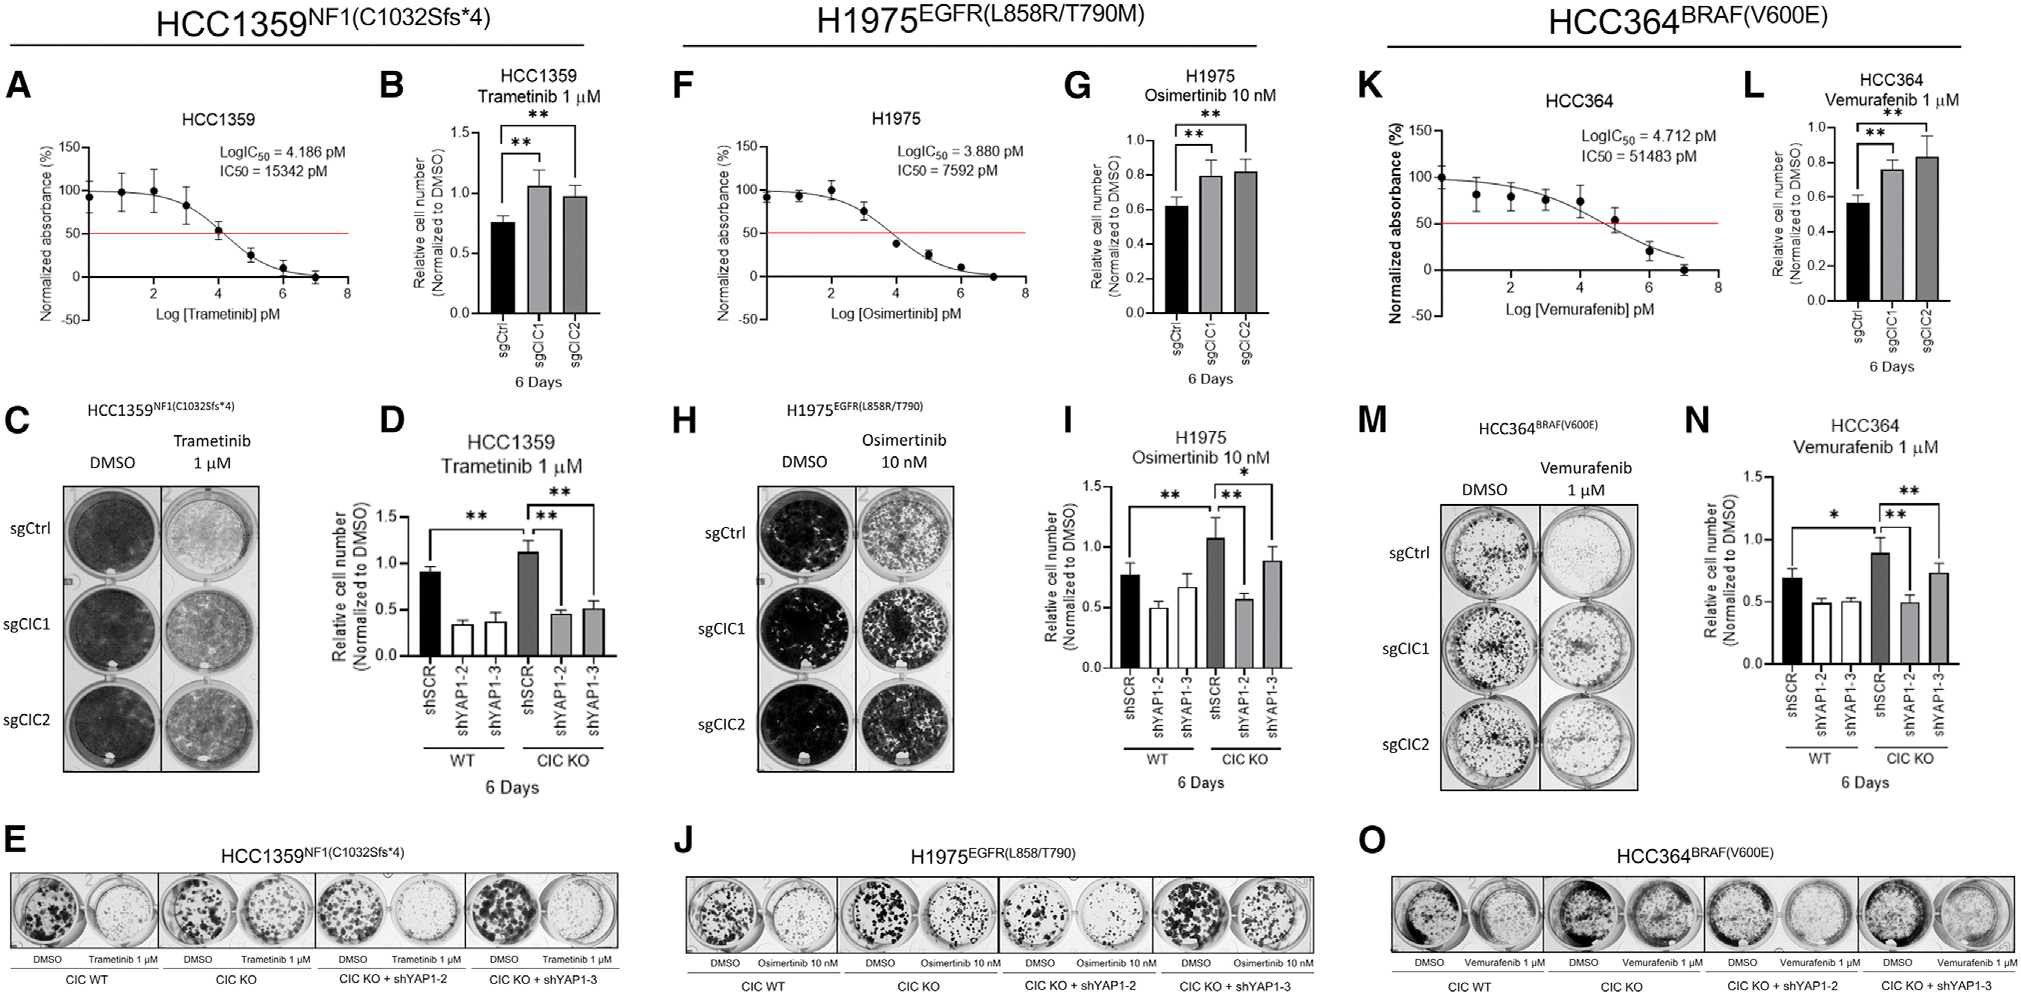
Figure 3. YAP in CIC-deficient human lung cancer drives tumor progression and resistance to MAPK inhibitors.

(A, F, and K) CTG viability curves in HCC1359 (A), H1975 (F), and HCC364 (K) following treatment with trametinib (tram), Osimertinib (osi), or vemurafenib (vem), respectively.
(B, G, and L) Relative cell number of HCC1359 (B), H1975 (G), and HCC364 (L) cells expressing sgCtrl, sgCIC1, or sgCIC2 and treated (6 d) with tram, osi, or vem, respectively. **p < 0.01.
(C, H, and M) Crystal violet (CV) assay of HCC1359 (C), H1975 (H), and HCC364 (M) cells expressing sgCtrl, sgCIC1, or sgCIC2 treated (10 d) with tram, osi, or vem, respectively.
(D, I, and N) Relative cell number of HCC1359 (D), H1975 (I), and HCC364 (N) cells expressing sgCtrl, sgCIC1, or sgCIC2 ± YAP1 KD (shYAP1–2 and shYAP1–3) treated (6 d) with tram, osi, or vem, respectively. *p < 0.05, **p < 0.01.
(E, J, and O) CV assay of HCC1359 (E), H1975 (J), and HCC364 (O) cells expressing sgCtrl, sgCIC1, or sgCIC2 ± YAP1 KD (shYAP1–2 and shYAP1–3) treated (10 d) with tram, osi, or vem, respectively. Error bars represent SD in all figures.
