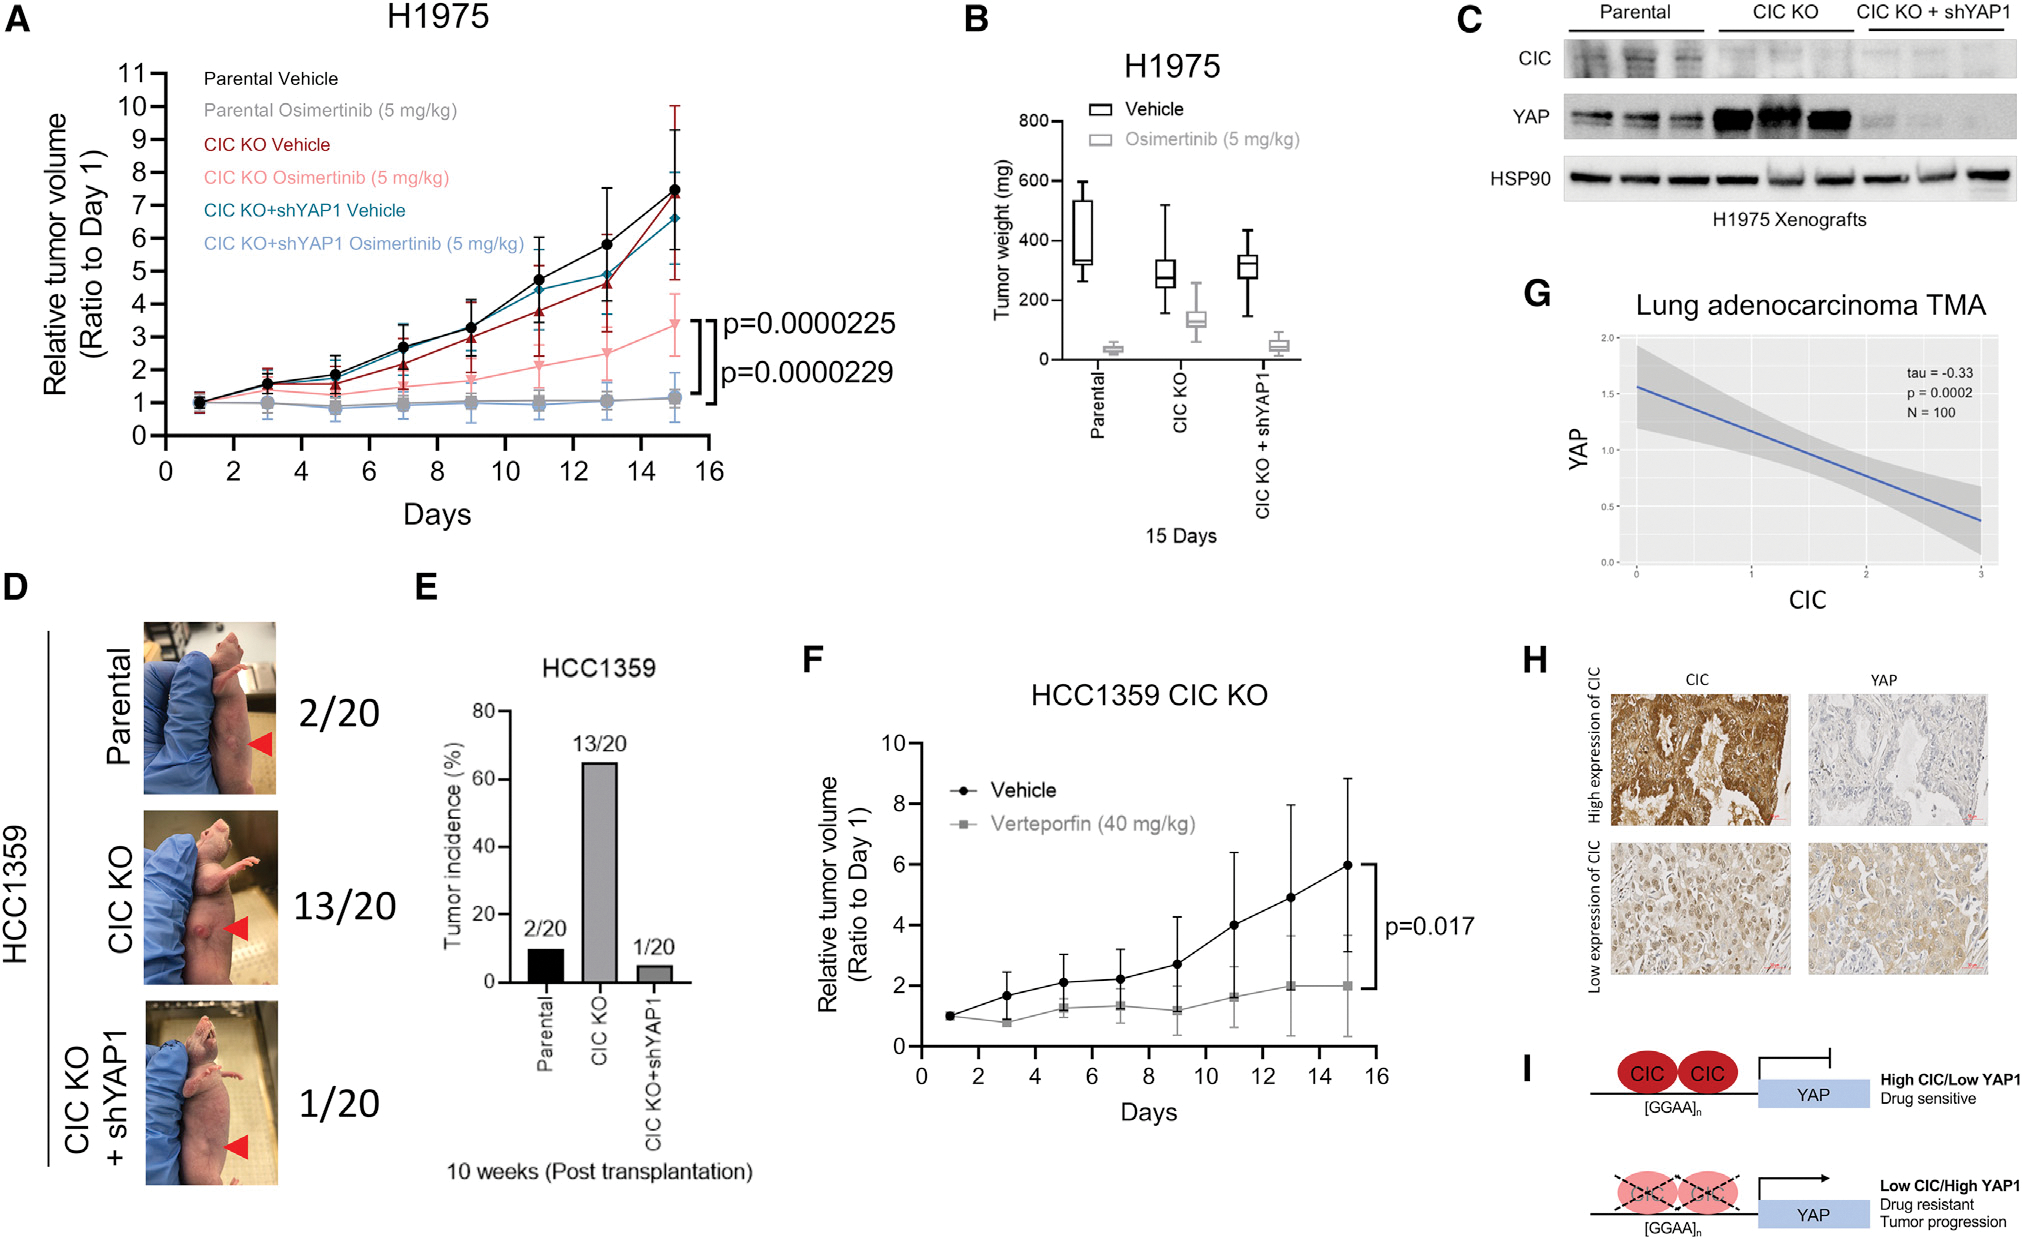
Figure 4. MAPK inhibitor resistance and tumor growth in CIC-deficient lung cancer are overcome through YAP1 inhibition in vivo.

(A) H1975 xenografts comparing vehicle or osimertinib-treated H1975, H1975 with CIC KO, or H1975 with CIC KO + YAP1 KD (n = 10).
(B) Tumor weights from mice harboring H1975, H1975 CIC KO, or H1975 CIC KO + YAP1 KD ± osimertinib.
(C) Immunoblots of CIC, YAP, and HSP90 expression in H1975 xenografts derived from tumors of different groups in (A).
(D) Representative figures of parental, CIC KO, or CIC KO + YAP1 KD in HCC1359 tumor-bearing mice.
(E) Bar graph comparing the incidence of HCC1359 (n = 2/20), HCC1359 CIC KO (n = 13/20), or HCC1359 CIC KO + YAP1 KD (n = 1/20) tumor formation in mice.
(F) Relative growth of HCC1359 CIC KO tumors treated with vehicle or verteporfin.
(G) Correlation plot between CIC and YAP expression from LC specimens (tau = −0.33, p = 0.0002, n = 100).
(H) Representative images of CIC and YAP-stained LC tissue. Scale bar, 50 μm.
(I) Model of CIC-mediated repression of YAP1 and phenotypes.
Error bars represent SD.
