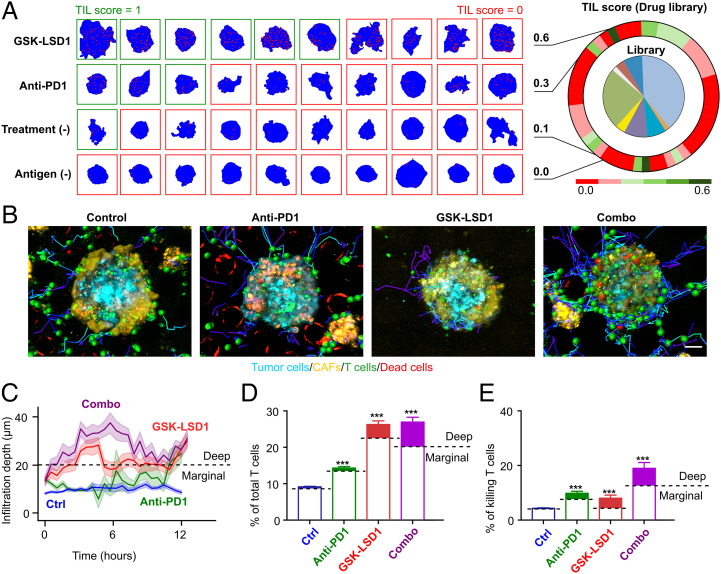
Fig. 4.
Deep learning–guided screening of an epigenetic drug library. (A) Screening results from the library. The heatmap shows TIL scores of control conditions and drug conditions. Representative images of the distribution of T cells (red dots) inside the spheroids (blue background) under different drug treatments. (B) Extraction of cell position and trajectory from time-lapse images of T cell infiltration and cytotoxicity within heterotypic tumor spheroids under four treatment conditions (untreated control, anti-PD1, GSK-LSD1, and combination treatment [combo]) (from Movie S2). (C) T cell infiltration depth over time under four treatment conditions. All of the lines are plotted with a 68% CI. (D) The average percentage of infiltrated T cells of total T cells. T cells deep within tumor spheroids (infiltration depth >20 µm) are considered to be deep infiltrating T cells and illustrated with filled colors. (E) Average killing T cell percentage of the total T cell population. Killing events located deep within tumor spheroids are labeled with filled colors. Statistical analysis: ANOVA. (Scale bar in B, 30 µm.)

