Fig. 1.
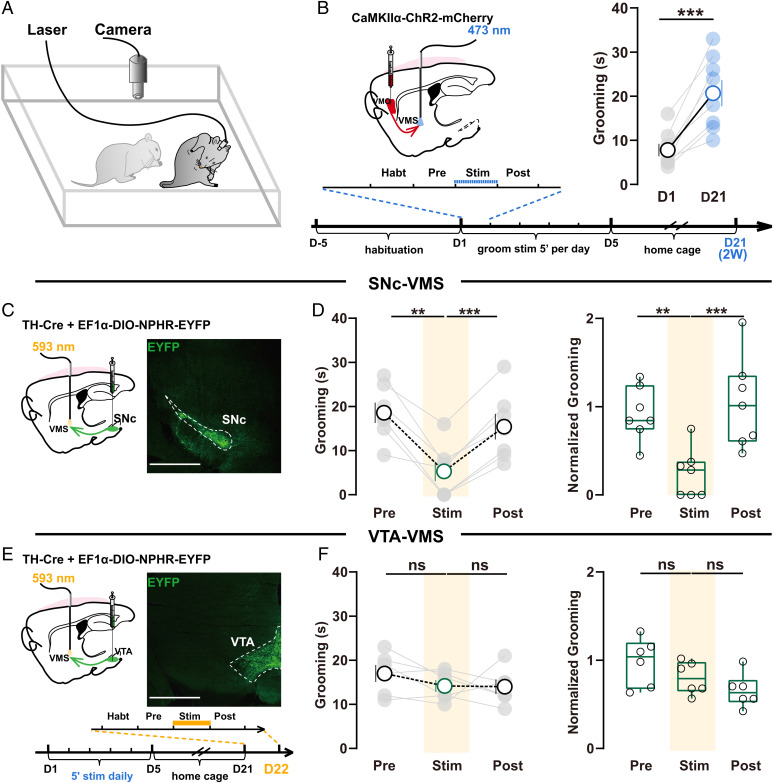
Inhibition of SNc–VMS pathway reduces OCD-like behavior. (A) Schematics showing video recordings of self-grooming in freely moving mice. (B) Schematic showing striatal localization of viral injection and fiber-optic implantation for induction of OCD-like behavior (Left). Two weeks after repeated stimulation, mice exhibited significantly increased grooming (Right; n = 8 mice; D1: 8 ± 1.414, D22: 20.88 ± 2.943; paired t test, P = 0.0007), demonstrating the establishment of OCD-like repetitive behavior. (C) Strategy for optogenetic manipulation of SNc-VMS projections. Left: schematic showing striatal localization of viral injections and fiber-optic implantation for regulation of OCD-like behavior. Right: coronal sections showing the injection sites of viral injection in SNc. Scale bar,1 mm. (D) Summarized data showing photoinhibition of SNc–VMS projections rapidly and reversibly suppressed the excessive self-grooming. Total (Left; NPHR: n = 7 mice; pre: 18.57 ± 2.308; stim: 5.286 ± 2.233; post: 15.43 ± 2.092; repeated-measure one-way ANOVA [RM one-way ANOVA] main effect: P = 0.001, F (1.880, 11.28) = 14.00; Tukey’s test: pre vs. stim, P = 0.0037; stim vs. post, P = 0.0003) and normalized grooming time (Right; EYFP: n = 6 mice; NPHR: n = 7 mice; after normalization, pre: 0.9209 ± 0.1144; stim: 0.2478 ± 0.1047; post: 1.040 ± 0.1956; RM one-way ANOVA main effect: P = 0.0022, F (1.189, 7.136) = 19.98; Tukey’s test: pre vs. stim, P = 0.0017; stim vs. post, P = 0.0006). The normalized data (Ni) were the ratio of raw data (Ri) to the averaged values of the control group. For detailed information, refer to SI Appendix, SI Material and Methods; all the raw data shown in SI Appendix, Fig. S2A in SNc-stimulated (NpHR) groups were monitored before (pre), during (stim), and after (post) stimulation. (E and F), Same as C and D except VTA–VMS projections were stimulated, scale bars in E, 1 mm. Inset: schematic of tethering habituation and stimulation paradigm to examine the role of SNc–VMS or SNc-VTA projections in regulation of OCD-like behavior for C and E. Photoinhibition of VTA–VMS projections terminals failed to affect grooming time in OCD-like mice (Left, NPHR: n = 6 mice; pre: 17 ± 1.915; stim: 14.17 ± 1.327; post: 14 ± 1.673; RM one-way ANOVA main effect: P = 0.0038, F (1.540, 7.699) = 13.92; Tukey’s test: pre vs. stim, P = 0.3247; stim vs. post, P = 0.9999; Right, EYFP: n = 6 mice; NPHR: n = 6 mice; after normalization, pre: 0.9808 ± 0.1105; stim: 0.8019 ± 0.07512; post: 0.6563 ± 0.07844; RM one-way ANOVA main effect: P = 0.093, F (1.507, 7.535) = 3.468; Tukey’s test: pre vs. stim, P = 0.182; stim vs. post, P = 0.5348; all the raw data shown in SI Appendix, Fig. S2B). All data are means ± SEM. Compared between indicated groups, **P < 0.01, ***P < 0.001, and ns, no significance.

