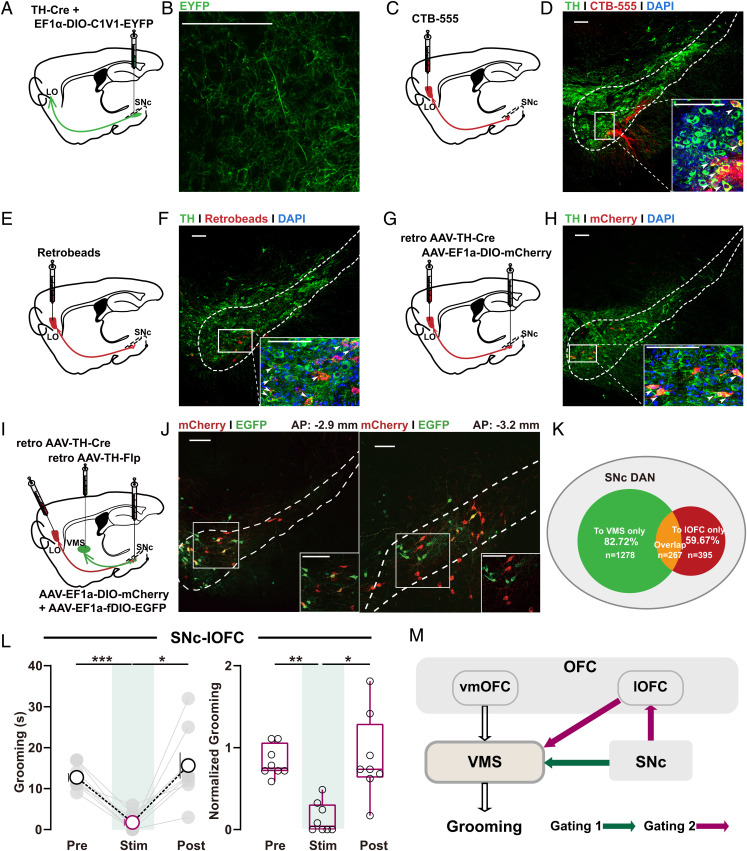
Fig. 2.
SNc–lOFC excitation alleviates OCD-like behavior. (A, C, E, and G) Schematics showing localization of viral injection for anterograde (A) or retrograde tracing (C, E, and G) of SNc–lOFC (LO) projections. (B, D, F, and H) Verification of SNc–lOFC projections evidenced by anterogradely labeled axons terminals (stained with EYFP) in lOFC (B) or retrogradely labeled DAN cell bodies in SNc using retrograde tracer CTB (D), retrobeads (F), or AAV-retro-TH-Cre (H). Images at the bottom right of D, F and H are high-magnification images of the boxed area in SNc. Scale bars, 100 μm. (I) Schematics showing localization of viral injection for retrograde tracing of SNc–lOFC and SNc–VMS projections. (J) Retrogradely traced DA neuron populations at SNc labeled by mCherry and EYFP, respectively. Inset in each panel, a high-magnification image of the boxed region. Scale bars, 100 μm. (K) Schematics showing the relationship between different DAN populations in SNc. (L) Summarized data showing acute photoactivation of SNc–lOFC projections rapidly and reversibly suppressed the OCD-like grooming behavior. Changes in total (Left) or normalized grooming time (Right) were observed (Left, C1V1: n = 8 mice; pre: 12.75 ± 1.048; stim: 1.75 ± 0.8183; post: 15.63 ± 3.173; RM one-way ANOVA main effect: P = 0.0035, F (1.301, 9.104) = 13.56; Tukey’s test: pre vs. stim, P = 0.0003; stim vs. post, P = 0.0215; Right, EYFP: n = 6 mice; C1V1: n = 8 mice; after normalization, pre: 0.8315 ± 0.0684; stim: 0.1419 ± 0.0664; post: 0.8844 ± 0.1796; Friedman test with Dunn’s multiple comparisons test: pre vs. stim, P = 0.0035; stim vs. post, P = 0.0179; all the raw data shown in SI Appendix, Fig. S2C). (M) Schematic diagrams showing the long-range SNc–VMS and putative SNc–lOFC–VMS pathways for dopaminergic gating over OCD-like behavior. Compared between indicated groups, *P < 0.05, **P < 0.01, and ***P < 0.001.

