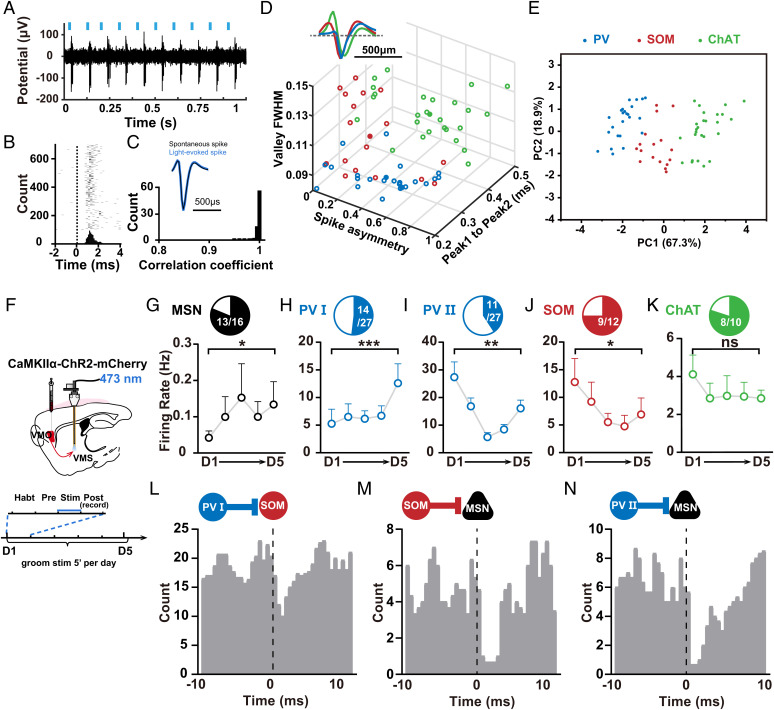
Fig. 4.
VMS microcircuits related to self-grooming dysregulation in OCD-like mice. (A) Representative recording of laser-evoked spiking in SOM–ChR2 mice. Blue lines represent laser pulses (5 ms, 10 Hz). (B) Raster plot and peri-stimulus time histogram (bin size, 0.5 ms) for laser-evoked spikes of the same ChR2-tagged SOM neuron shown in A. Dashed line, laser onset time. (C) Waveform comparison between light-evoked and spontaneous spikes. Top, averaged waveforms of light-evoked spikes (blue) and spontaneous spikes (black) of an example neuron. Bottom, distribution of correlation coefficient between light-evoked and spontaneous spike waveforms for all 67 optogenetically identified neurons at VMS. (D) Separation of striatal interneuron subtypes based on physiological properties for optogenetically identified neurons. The parameters of mean waveforms for each neuron were plotted against each other, revealing three clear clusters corresponding to PV, SOM, and ChAT interneurons (SI Appendix, Fig. S5 B–E). (E) Classification of neurons based on PC 1 and PC 2 after PCA. (F) Schematics showing localization of viral injections and optrode recordings. (G–K) Activity changes in optogenetically identified striatal neuron subtypes during induction of OCD-like behavior for 5 consecutive days ((G) n = 16 neurons, D1: 0.0421 ± 0.01867, D5: 0.1338 ± 0.0627, D1 vs. D5, Wilcoxon signed rank test, P = 0.0498; (H) n = 14 neurons, D1: 5.25 ± 2.64, D5: 12.59 ± 3.508, D1 vs. D5, Wilcoxon signed rank test, P = 0.0001; (I) n = 11 neurons, D1: 27.36 ± 5.516, D5: 16.06 ± 2.992, D1 vs. D5, Wilcoxon signed rank test, P = 0.002; (J) n = 12 neurons, D1:12.76 ± 4.257, D5: 6.898 ± 2.988, D1 vs. D5, Wilcoxon signed rank test, P = 0.0391; (K) n = 10 neurons, D1: 4.112 ± 1.016, D5: 2.843 ± 0.4317, D1 vs. D5, paired t test, P = 0.1324). (L–N) Putative synaptic connections revealed by sequences of firing alterations among different neuron subtypes. Monosynaptic connections were associated with precisely timed spiking relationships at short (<5 ms) latency offsets between two connected neurons (41). Cross-correlogram of spike trains was achieved by examining counts of co-occurrences of spiking between the neuron pairs at various differential time lags. (L) PV I–SOM neuron pair; (M) SOM–MSN neuron pair; (N) PV II–MSN neuron pair. PV I neurons with increased activity under OCD state subsequently inhibit SOM that directly connects with them and caused reduced activities of SOM neurons, which in turn disinhibited MSNs. In addition, according to the sequences for firing alterations, PV II cells with reduced activity were observed directly preceding MSNs and subsequently disinhibited MSNs. Compared between indicated groups, *P < 0.05, **P < 0.01, and ***P < 0.001.

