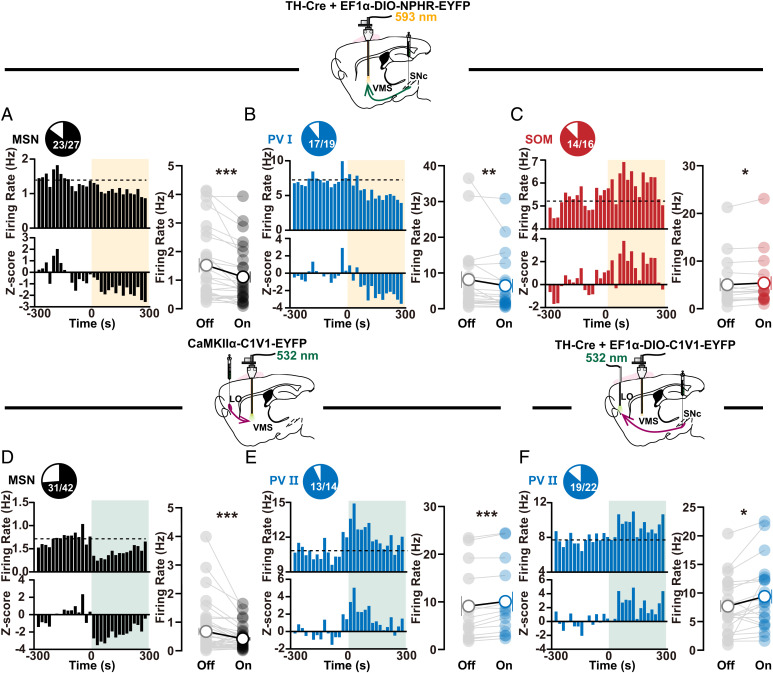
Fig. 5.
Distinct activity changes in VMS microcircuits mediated by two SNc-mediated pathways. (A–C) Activity changes in optogenetically identified striatal MSN ((A) n = 27 neurons, off: 1.521 ± 0.2472, on: 1.11 ± 0.1953, off vs. on, Wilcoxon signed rank test, P < 0.0001), PV I ((B) n = 19 neurons, off: 8.135 ± 2.301, on: 6.448 ± 1.893, off vs. on, Wilcoxon signed rank test, P = 0.0023), and SOM ((C) n = 16 neurons, off: 5.054 ± 1.358, on: 5.388 ± 1.433, off vs. on, Wilcoxon signed rank test, P = 0.0175) cell subtypes during photoinhibition of SNc–VMS axon terminals in OCD-like mice. Statistical plotting (Right in each panel) shows decreased firing in MSNs and PV I cells, as well as increased firing in SOM cells (Wilcoxon signed rank test). (D–F) Same as A–C except lOFC–VMS (D and E) ((D) n = 42 neurons, off: 0.6757 ± 0.1271, on: 0.4162 ± 0.06156, off vs. on, Wilcoxon signed rank test, P = 0.0003; (E) n = 14 neurons, off: 9.116 ± 2.07, on: 10.06 ± 2.064, off vs. on, paired t test, P = 0.0002) or SNc-lOFC ((F) n = 22 neurons, off: 7.695 ± 1.035, on: 9.397 ± 1.238, off vs. on, paired t test, P = 0.0214) projections were photoactivated. In contrast to the results in A–C, increased firing was observed in PV II cells (Wilcoxon signed rank test or paired t test). Compared between indicated groups, *P < 0.05, **P < 0.01, and ***P < 0.001.

