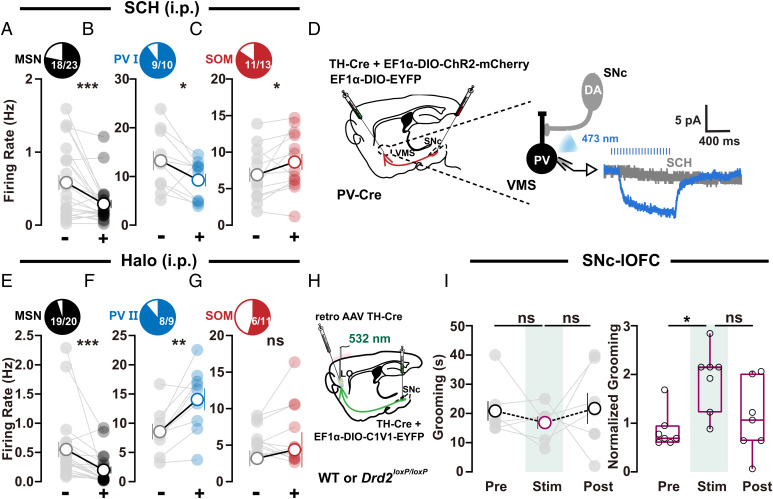
Fig. 6.
D1R and D2R antagonists differentially regulate VMS microcircuits. (A–C) Activity changes in MSNs, PV I, and SOM neurons in VMS after treatment with D1 receptor blocker SCH ((A) n = 23 neurons, −: 0.5839 ± 0.1027, +: 0.2899 ± 0.05704, − vs. +, Wilcoxon signed rank test, P = 0.0009; (B) n = 10 neurons, −: 13.22 ± 1.982, +: 9.257 ± 1.31, − vs. +, Wilcoxon signed rank test, P = 0.0488; (C) n = 13 neurons, −: 6.896 ± 0.9854, +: 8.651 ± 1.114, − vs. +, paired t test, P = 0.0445). (D) Optogenetic stimulation of SNc axon terminals in VMS elicited a slow deflection that was totally abolished by D1R antagonist SCH (10 μM). (E–G) Activity changes in MSNs, PV II, and SOM neurons after treatment with D2 receptor blocker Halo ((E) n = 20 neurons, −: 0.5512 ± 0.1305, +: 0.1988 ± 0.06089, − vs. +, Wilcoxon signed rank test, P < 0.0001; (F) n = 9 neurons, −: 8.569 ± 1.323, +: 14.07 ± 1.872, − vs. +, paired t test, P = 0.0059; (G) n = 11 neurons, −: 5.758 ± 0.5968, +: 6.398 ± 1.322, − vs. +, Wilcoxon signed rank test, P = 0.7002). (H) Schematic showing localization of viral (retro AAV TH-Cre) injections for selective knockout of D2 autoreceptors in SNc DA neurons and fiber-optic implantation for stimulation of SNc–lOFC projections. (I) Summarized data showing that, in OCD-like mice with D2Rs knockout in SNc DA neurons (H), SNc–lOFC excitation failed to exert any effect on grooming time. Changes in total (Left, Drd2loxP/loxP: n = 7 mice; pre: 20.86 ± 3.355; stim: 16.86 ± 2.143; post: 21.71 ± 5.299; RM one-way ANOVA main effect: P = 0.5694, F (1.319, 7.912) = 0.4605; Tukey’s test: pre vs. stim, P = 0.5622; stim vs. post, P = 0.7766) or normalized grooming time (Right, wild type [WT]: n = 6 mice, Drd2loxP/loxP: n = 7 mice; after normalization, pre: 0.9003 ± 0.1448; stim: 1.945 ± 0.2473; post: 1.143 ± 0.2789; RM one-way ANOVA main effect: P = 0.0661, F (1.095, 6.572) = 4.761; Tukey’s test: pre vs. stim, P = 0.019; stim vs. post, P = 0.3016). Significance between pre and stim (Right) was caused by data normalization, and the normalized data (Ni) was the ratio of raw data (Ri) to the averaged values of the control group. For detailed information, refer to SI Appendix, SI Material and Methods; all the raw data are shown in SI Appendix, Fig. S2D. Compared between indicated groups, *P < 0.05, **P < 0.01, and ***P < 0.001.

