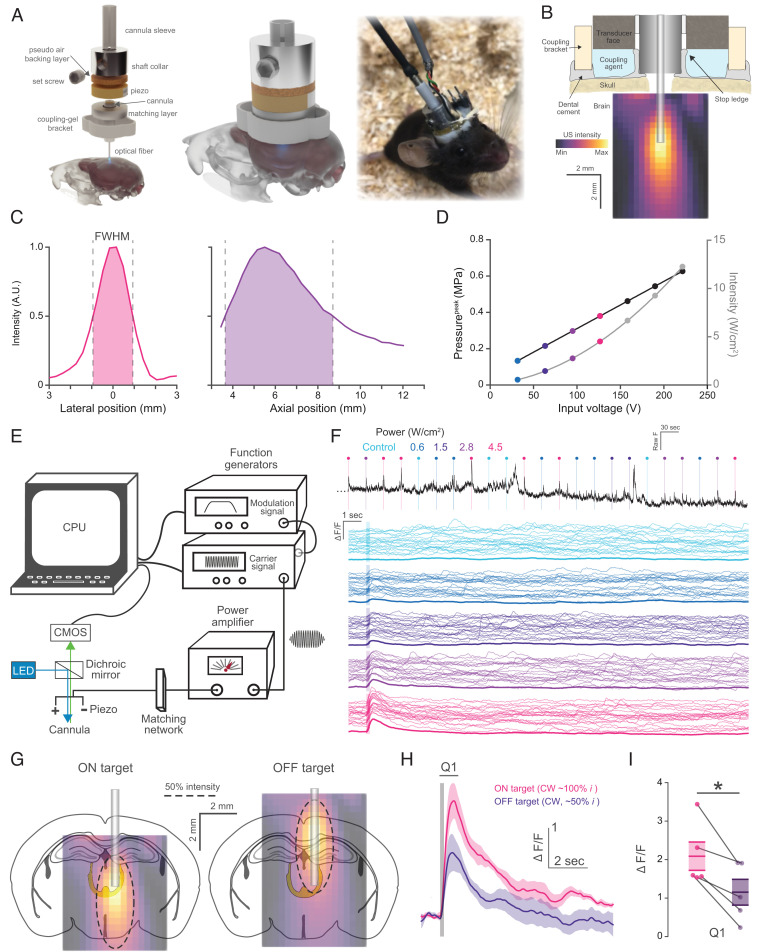
Fig. 1.
A tool for integrating FUS with fiber photometry. (A) Exploded (Left), assembled (Middle), and real model view of the PhoCUS device. (B) Cross-sectional illustration of the PhoCUS device and the relative ultrasound intensity field produced in the brain. (C) Hydrophone characterized FWHM intensity profiles where the axial position represents distance from the transducer face. (D) Peak pressure and ISPPA with incremental peak input voltage. (E) Schematic representation of the integrated ultrasound waveform generation and photometry computational system. (F) Representative experiment where 200 ms continuous wave pulses of varying intensity are delivered to CAMKII+ neurons of the midbrain locomotor region in shuffled order and averaged across trials. The top black trace shows a subset of experimental signals (23/100 trials) and colored traces show all trials (thin) for each intensity and the mean (thick). (G) Illustration of CMT ON or OFF targeting by adjusting the transducer set height along the z-axis of the cannula (dash line represents FWHM boundary) (H) Mean cell type change in fluorescence (line) in response to continuous ultrasound pulse (gray bar, 200 ms) (n = 5 animals, five trials/animal, shaded area: SEM). (I) Quantification of Q1 period for ON and OFF target (paired t test; *P = 0.014).

