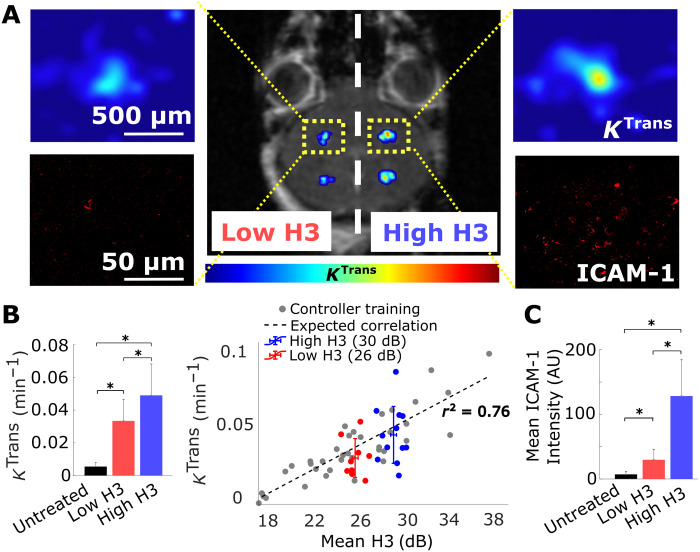
Fig. 2. Closed-loop controlled BBB opening in healthy brain.
(A) Representative image showing enhancements of Ktrans (color bar represents pharmacokinetic map intensity) and ICAM-1 in healthy brain after closed-loop controlled sonication with two target AE levels. (B) Quantification of Ktrans after sonication. Permeability changes after the sonication at different target levels had a significant increasing trend and correlated well with the training data (n = 5 animals total, two sonications of each target level at both sides for four animals, and one animal dedicated only for four targets of high H3, *P < 0.05). Untreated represents the untreated contralateral hemisphere. (C) Quantification of ICAM-1 expression at sonicated regions. ICAM-1 had exposure-dependent up-regulation that follows the Ktrans trend (*P < 0.05). Untreated represents the untreated contralateral hemisphere. One-way analysis of variance (ANOVA) was used as significant test; error bars indicate SE. AU, arbitrary units.

