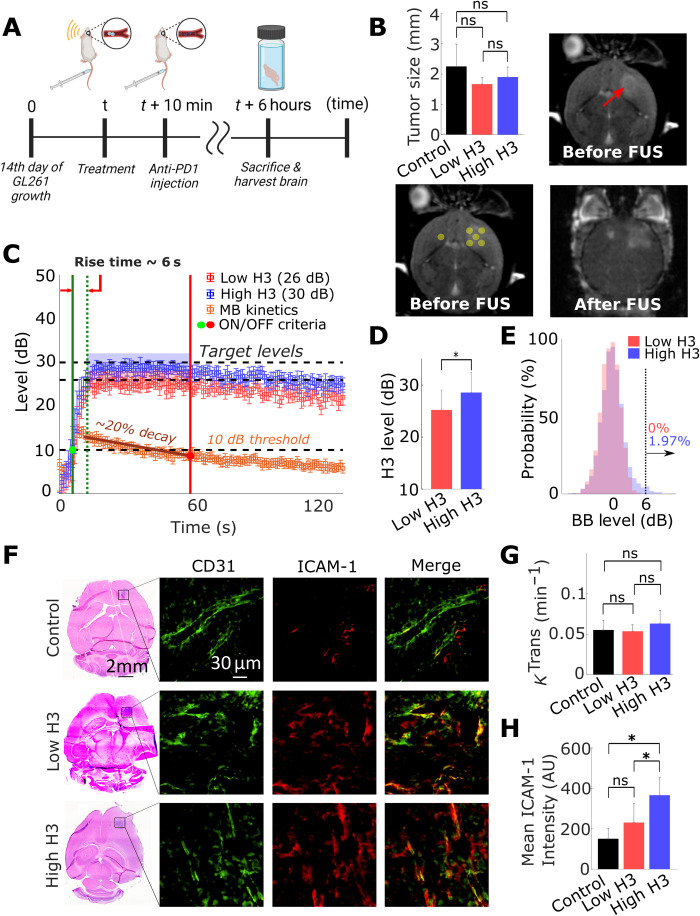
Fig. 3. Closed-loop control of ICAM-1 up-regulation in TME.
(A) Experimental protocol used in tumor-bearing mice. (B) Sonication pattern and tumor size quantification. Same target levels for closed-loop controller from healthy mice study were used (26 and 30 dB). Bottom left: Sonication pattern for each target level group (control, n = 4; low H3, n = 3; and high H3, n = 5) is shown/overlaid in the T1-weighted MRI with circles. One healthy brain target was sonicated to confirm the targeting accuracy of USgFUS system. Control group had anti-PD1 injection without sonication. Top left: Quantification of tumor sizes across groups. Tumor diameter across all groups was approximately equal to 2 mm. (C) Closed-loop controller performance during sonication. Controller achieved mean rise time of 6 s with precision of 3 dB. (D) Performance evaluation of the controller in the brain TME. The controller was able to distinguish two target AE levels (*P < 0.05). (E) Broadband emission probability during controlled sonication. High H3 (30 dB) group had 1.97% of broadband (>6 dB) occurrence; low H3 (26 dB) group had no broadband emission. (F) Representative H&E and fluorescence microscopy images showing ICAM-1 up-regulation in the high H3 group. (G) Quantification of Ktrans in tumors. Ktrans value did not have significant variance across the groups (*P > 0.05). (H) Quantification of ICAM-1 expression in tumors. ICAM-1 expression increased significantly (*P < 0.05) at high H3 target level compared to control group and low H3 group. One-way ANOVA was used as significant test; error bars indicate SE.

