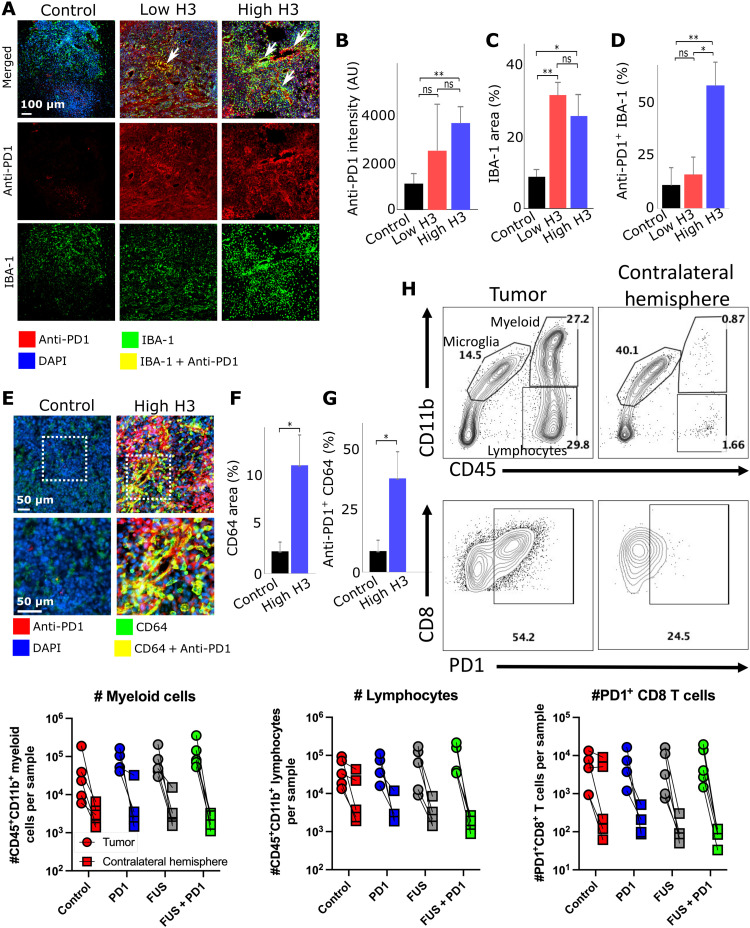
Fig. 4. Closed-loop control of anti-PD1 delivery and resulting macrophage accumulation in TME.
(A) Representative fluorescent microscopy of anti-PD1 delivery and TAM quantification (control, n = 4; low H3, n = 3; and high H3, n = 5). (B) Quantification of anti-PD1 delivery in tumor. High H3 group had 2.5-fold improvement in anti-PD1 intensity in TME compared to control group (**P < 0.01). No significances were observed between low H3 and control group, as well as high H3 group. (C) Quantification of IBA-1 area in TME. High H3 group and low H3 group had significant increase (3- and 3.5-fold) in IBA-1 area (*P < 0.05 and **P < 0.01). No significances were observed between high H3 and low H3 group. (D) Quantification of anti-PD1/IBA-1 colocalization. Percentages indicate colocalized area over IBA-1+ area. High H3 group had significant increase in colocalization area (5.5-fold) compared to control group (**P < 0.01) and a 3.5-fold increase compared to low H3 group (*P < 0.05). No significant colocalization was observed between control and low H3 group. (E) Representative fluorescent microscopy of anti-PD1 delivery and CD64. Red, green, blue, and yellow indicate anti-PD1+, CD64+, DAPI, and anti-PD1/CD64 colocalization, respectively. (F) Quantification of CD64+ area. High H3 group had a significant fivefold (*P < 0.05) higher expression of CD64+ area compared to control group. (G) Quantification of CD64/anti-PD1 colocalization. Percentages indicate colocalized area over CD64+ area. High H3 group had a fivefold increase in colocalization compared to control group (*P < 0.05). (H) PD1-stained flow cytometry (anti-PD1 only, n = 4; for all other groups, n = 5). More channels can be seen in fig. S7. One-way ANOVA was used as significant test; error bars indicate SE

