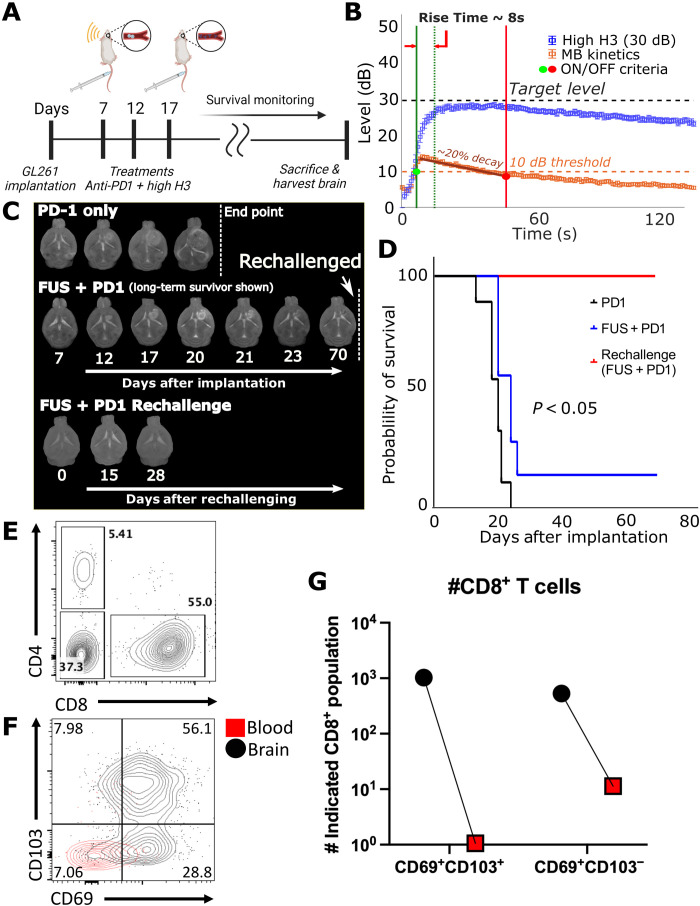
Fig. 5. Survival study.
(A) Experimental protocol of survival study (control, n = 9; high H3, n = 9). (B) Acoustic emissions for all survival mice. (C) T2-weighted MR images throughout treatments and survival monitoring. One animal (shown as FUS + PD1) survived and had its tumor cured and was rechallenged at day 70. Rechallenged animal did not express any endpoint criteria after 28 days. (D) Kaplan-Meier survival analysis between control group and high H3 group. Significant improvement in survival was observed between sonicated group and control group (P < 0.05). (E) Flow cytometry plot showing CD4+ and CD8+ lymphocytes (gated on CD45+CD11b−) in the rechallenged brain. (F) Flow cytometry plot showing CD69 and CD103 expression (gated on CD45+CD11b−CD8+) on CD8 T cells in the rechallenged brain (black) and blood (red). (G) Quantification of total CD69+CD103+CD8 T cells in the rechallenged brain and blood.

