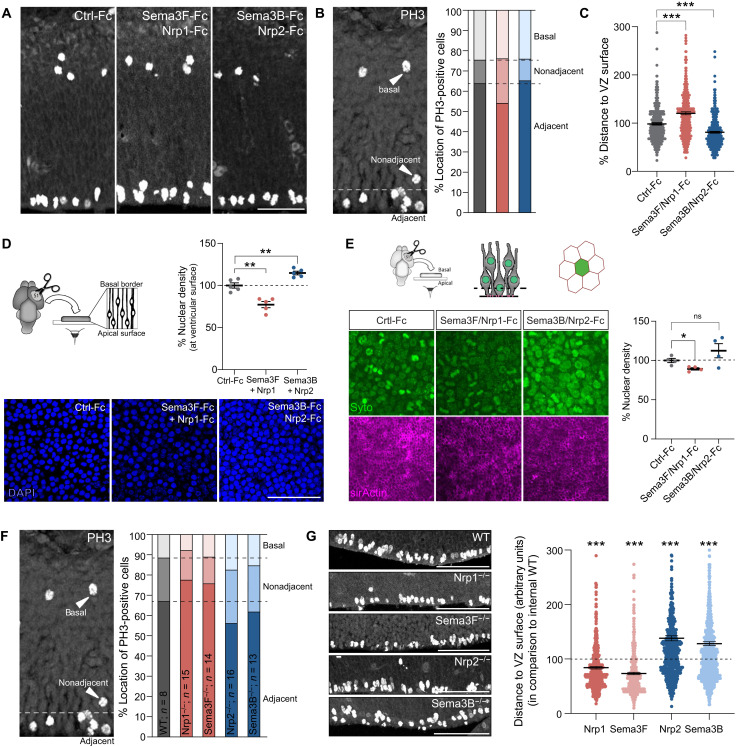
Fig. 5. Apically delivered Sema/Nrp complexes regulate the positioning of mitotic nuclei.
(A) Anti-PH3 immunostaining of E12.5 sections following injections of recombinant Sema3/Nrp-Fc or control-Fc (B) PH3-positive nuclei was classified as ventricular, displaced, or basal, according to their position in the cortical wall. (C) Analysis of the distance of apical PH3-positive nuclei relatively to the ventricular surface. Means ± SEM; each dot represents one RGC (n = 2 embryos); KS test, ***P < 0.001. (D) Cortices were apposed to coverslips coated with recombinant Sema3/Nrp-Fc, fixed, and nuclei labeled with Hoechst. The most apical nuclei were imaged with a confocal microscope and counted. Means ± SEM; each dot represents one embryo; paired t test, **P < 0.01. (E) Cortices were apposed to coverslips coated with recombinant Sema3/Nrp for 30 min. Apical SYTO16-labeled nuclei were live-imaged with confocal microscope in “en face” configuration. The position of the acquisition level with respect to Z axis (dotted line) was calibrated relatively to SiR-actin–positive apical endfeet. Less nuclei were present on the apical surface of cortices exposed to Sema3F/Nrp1-Fc. In turn, exposure to Sema3B/Nrp2-Fc resulted in more nuclei present on the apical surface. These differences are reflected in the intensity of the SYTO16 signal. ns, not significant. (F) Anti-PH3 immunostaining of cortex sections of E12.5 of Sema3 and Nrp mutants in respect to control littermates. (G) Quantification of the relative distance between apical PH3-positive nuclei and the ventricular surface. Means ± SEM; each dot represents one RGC (n = 3 embryos); KS test, ***P < 0.001. Scale bars, 100 μm (A, D, and G).

