. 2022 Nov 18;11:e82094. doi: 10.7554/eLife.82094

Figure 5. The microglia centrosome is a microtubule organization centre (MTOC) and moves into successful phagocytic branches.

(A) Macrophage (magenta; Tg(csf1ra:GAL4-VP16; UAS:lyn-tagRFPt)) with the centrosome (UAS:miRFP670-cetn4) and microtubules (green; Tg(UAS:EB3-GFP)) labelled. The centrosome can be seen right in the centre of the MTOC (box). (B) Microglia (grey; Tg(csf1ra:GAL4-VP16; UAS:lyn-tagRFPt)) with microtubules (cyan; Tg(UAS:EB3-GFP)) labelled. The MTOC can be seen as a bright spot of growing microtubules (arrow). Top: a successful phagocytic event, full time lapse in Figure 5—video 2. The newly formed phagosome is marked with an asterisk. Bottom: an aborted attempt marked with an asterisk.

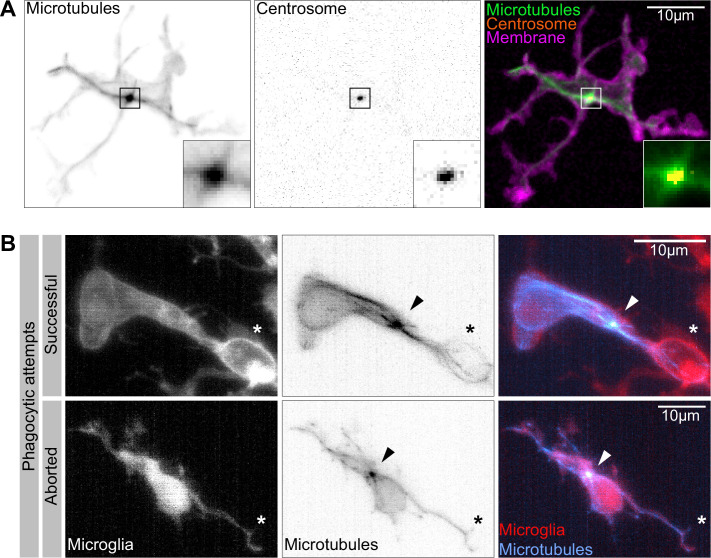
Figure 5.

Figure 5—video 1. The microglia microtubule organization centre (MTOC) visualized as a dense cluster of EB3 comets.
Download video file (796.2KB, mp4)
Time lapse of a representative microglia expressing the EB3 plus-end microtubule reporter (black; Tg(csf1ra:Gal4-VP16; UAS:EB3-GFP)) showing the MTOC as a dense cluster of growing microtubule tips. Images were captured every 15 s for 10 min using single-plane illumination microscopy (SPIM). Timescale is mm:ss.
Figure 5—video 2. The microglia microtubule organization centre (MTOC) moves into successful phagocytic branches.
Download video file (3.7MB, mp4)
Time lapse of a representative microglia (grey; Tg(csf1ra:GAL4-VP16; UAS:lyn-tagRFPt)), expressing the EB3 plus-end microtubule reporter (cyan; Tg(UAS:EB3-GFP)). The MTOC can be seen as a bright spot of growing microtubules that moves into the phagocytic branch during phagocytosis. Images were captured every 20 s for 35 min. Timescale is hh:mm:ss.