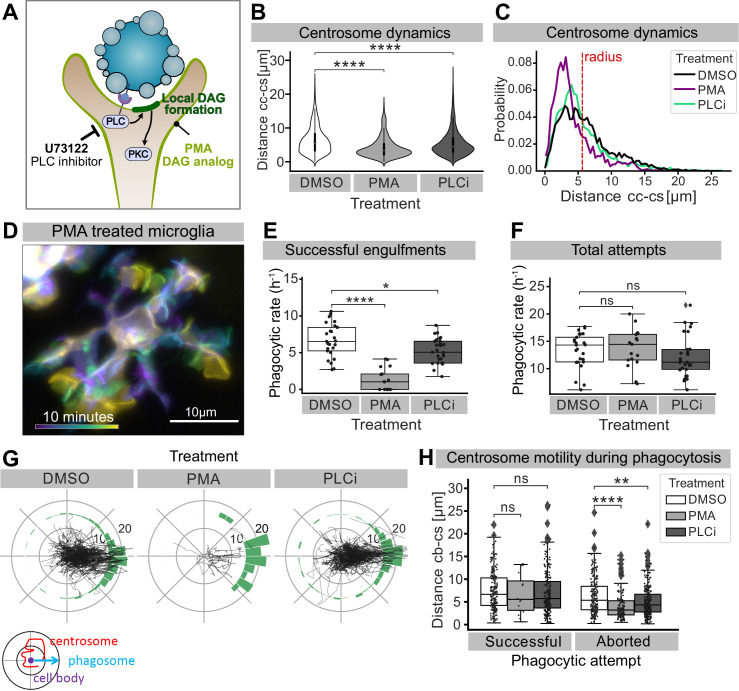
Figure 8. Perturbing DAG signalling affects centrosomal motility and phagocytosis.
(A) Schematic showing the effect of phorbol 12-myristate 13-acetate (PMA) and pan-inhibitor of PLC (PLCi) on DAG-mediated signalling. (B) Distance of the centrosome from the cell centre in microglia after 1% DMSO (N = 4, n = 26), 2.5 μM PMA (N = 3, n = 17) or 1 μM U73122 (N = 4, n = 29) treatment. (C) Probability map of the radial location of the centrosome, relative to the cell centre, after DMSO, PMA, or PLCi treatment. (D) A colour-coded overlay of a 10 min time lapse of a representative microglia (Tg(mpeg1:Gal4; UAS:lyn-tagRFPt)) treated with 2.5 μM PMA, to show branch dynamics. (E, F) Phagocytic attempts by microglia treated with 1% DMSO (white), 2.5 μM PMA (light grey) or 1 μM U73122 (dark grey). Plots show (E) successful and (F) total phagocytic attempts (*p<0.05, ****p<0.0001). (G) Tracks of the centrosome relative to successful phagocytic events, after DMSO, PMA, or PLCi treatment. Histograms summarize the position of the centrosome at the time of phagosome formation. (H) Centrosome distance from cell centre at the time of successful or aborted phagocytic attempts, after DMSO, PMA, or PLCi treatment (*p<0.05, **p<0.01, ***p<0.001, ****p<0.0001). Violin and boxplots depict mean and 1.5x interquartile range. Groups were compared using an unpaired, nonparametric Kruskal-Wallis with Bonferroni correction. N refers to the number of zebrafish and n to the total number of microglia analysed.


