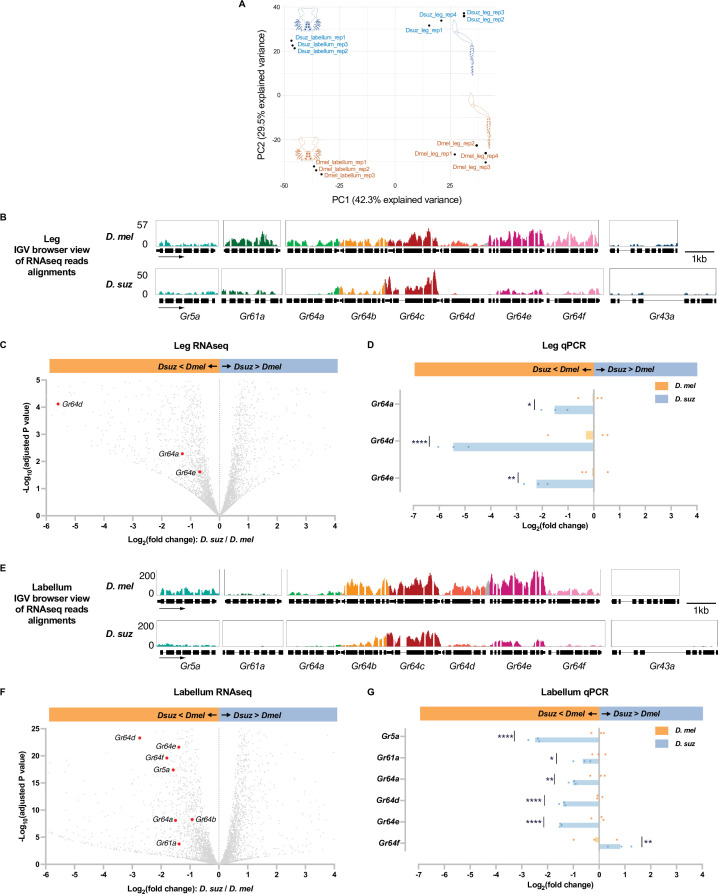
Figure 4. Reduced expression of taste receptor genes in the D. suzukii labellum and leg.
(A) Principal component analysis of the labellar and leg transcriptomes of D. melanogaster and D. suzukii. (B) Integrated genomics viewer (IGV) browser view of the aligned reads of the nine sugar Gr genes from RNAseq of the legs in both species. Y-axis is adjusted based on the number of mapped reads for qualitative comparison between species. (C) Volcano plot of leg transcriptome highlighting differentially expressed sugar Gr genes (|log2FC|≥0.58, adjusted p-value<0.05). All other analyzed genes with −log10 (adjusted p-value) less than 5 and log2 fold-change between –6 and 4 are shown in gray. (D) RT-quantitative PCR (qPCR) analysis of three Gr sugar receptor genes that were differentially expressed in the RNAseq analysis. Multiple unpaired t-tests are used to compare the expression level between species. n=3. *p<0.05; **p<0.01; ****p<0.0001. (E) IGV browser view of the aligned reads of the nine sugar Gr genes from RNAseq of the labellum. Y-axis is adjusted based on the number of mapped reads for qualitative comparison between species. (F) Volcano plot of labellar transcriptome highlighting differentially expressed sugar Gr genes (|log2FC|≥0.58, adjusted p-value<0.05). All other analyzed genes with −log10 (adjusted p-value) less than 25 and log2 fold-change between –6 and 4 are shown in gray. (G) RT-qPCR results of five sugar Gr genes in the labellum. Multiple unpaired t-tests are used to compare the expression level between species. n=3. *p<0.05; **p<0.01; ****p<0.0001.


