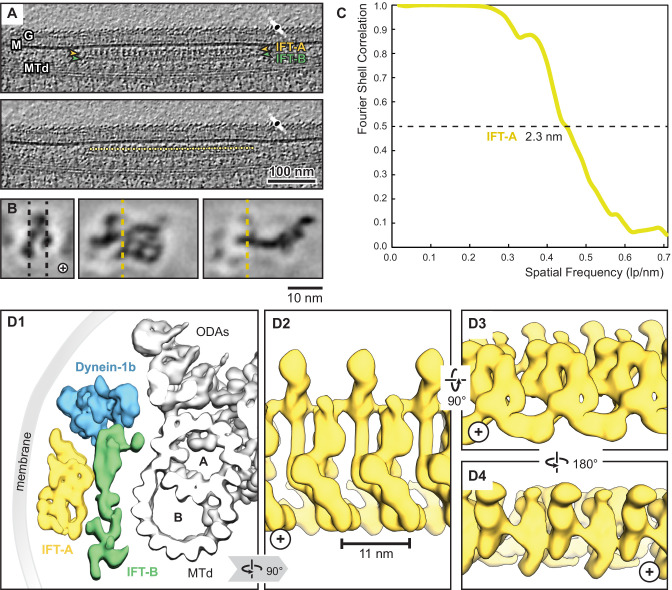
Figure 3. Overview of the IFT-A cryo-ET structure.
(A) IFT train in a raw tomogram of a C. reinhardtii cilium with the section showing the repeats of IFT-A and IFT-B. The picking of IFT-A particles is shown in the lower panel (MTd, microtubule doublet; G, glycocalyx; M, membrane; the direction of the ciliary tip is to the right side). (B) Subtomogram average of IFT-A; the left panel shows the same orientation as in A (plus, direction of the ciliary tip). Vertical dashed lines in the left panel indicate slice sections corresponding to the middle and right panels, respectively. (C) The Fourier shell correlation of the subtomogram average indicates a resolution of 2.3 nm at a cut-off criterion of 0.5. The pixel size is 0.71 nm. (D1) 3D isosurface of a reconstructed IFT train in between the membrane and the microtubule doublet as seen from the ciliary base towards the tip (ODAs, outer dynein arms; A, B, A-, and B-tubule) and composed of three averages: IFT-A (yellow), IFT-B (green) and dynein-1b (blue). (D2) The IFT-A polymer as seen from the membrane towards the microtubule doublet. (D3) and (D4) Views of IFT-A as indicated.

