. 2022 Nov 8;11:e81977. doi: 10.7554/eLife.81977

Figure 4. A model of the IFT-A train based on docking the monomeric model into the subtomogram average.

(A) The final cluster centroid model fit into the five IFT-A polymeric repeat subtomogram average map using molecular dynamics-based flexible fitting (Kidmose et al., 2019). (B) An alternative side view of the IFT-A trains to show interactions between adjacent monomers. Plus signs in A,B indicate the direction of the ciliary tip. (C) The IFT121-IFT122 interaction in the train-docked model with satisfied intermolecular cross-linked pairs shown in red. (D) The interaction between IFT122-IFT140-IFT144 is shown with satisfied intermolecular cross-links in red. (E) The interaction between IFT43-IFT121-IFT139 with satisfied intermolecular cross-links between IFT121 and IFT139 shown.

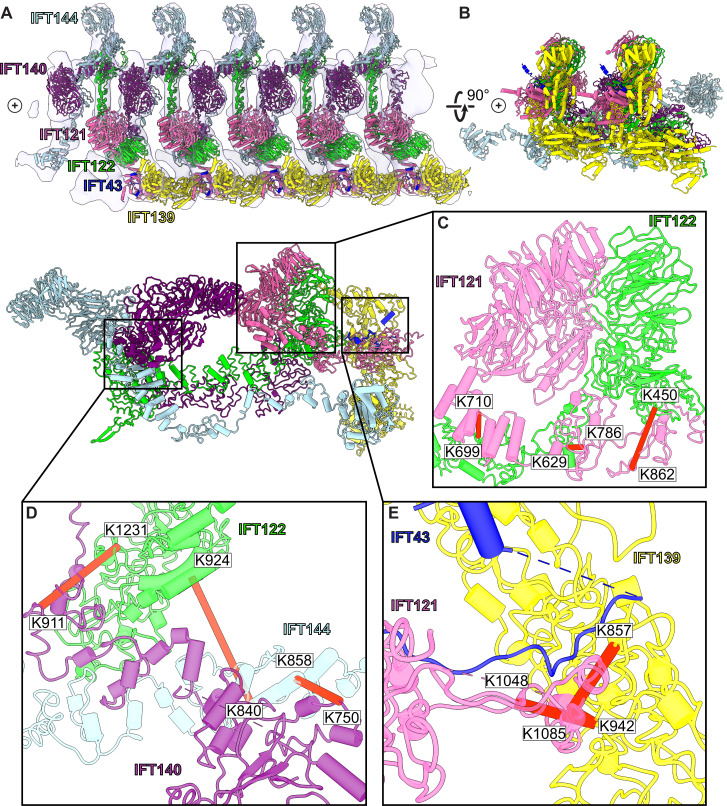
Figure 4.

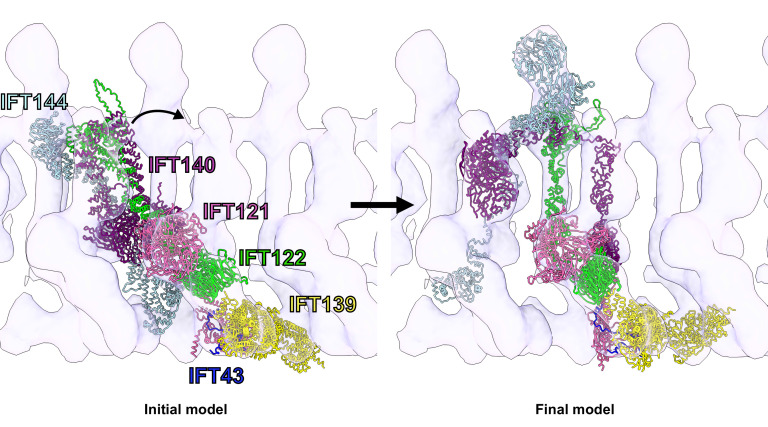
Figure 4—figure supplement 1. Flexible fitting of the IFT-A integrative model into the 23 Å subtomogram average of an anterograde IFT-A train.

Figure 4—figure supplement 1.

The starting position of the IFT-A integrative model (left panel) was determined by rigidly docking the model into the subtomogram average cryo-ET density using the ChimeraX fit-in-map tool (Goddard et al., 2018). The final structure (right panel) was obtained by flexibly fitting into the density using Namdinator (Kidmose et al., 2019). Figure 4—video 1 provides a visualization of the IFT-A conformational changes required to fit the monomer into the polymeric train.
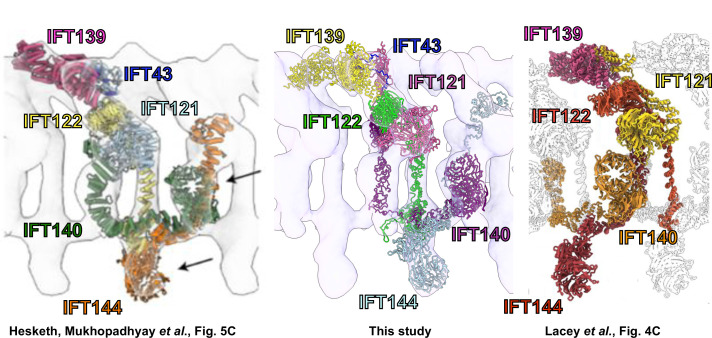
Figure 4—figure supplement 2. Independent 3D structural models of IFT-A derived by distinct workflows nonetheless compare favorably.

Figure 4—figure supplement 2.

A comparison of our model (center panel), based on determining a monomeric structure using cross-linking mass spectrometry, AlphaFold2, and integrative modeling, followed by docking into a 23 Å subtomogram average of polymeric IFT-A, compares favorably with (left panel, reprinting Figure 5C of Hesketh et al., 2022) a monomeric structure determined by single particle cryo-EM then docked into a 30 Å subtomogram average of polymeric IFT-A, as well as with (right panel, reprinting Figure 4C of Lacey et al., 2022) a polymeric IFT-A model built into an 18 Å subtomogram average. Note the latter model omits IFT43 and the repeating IFT-A monomer adopts an alternative choice of neighboring IFT140/144 subunits, but otherwise shows similar packing of subunits within the cryo-ET density map. (Reprinted images are used with permission under CC-BY-NC-ND 4.0 International license and are unchanged apart from adding labels for clarity.).
© 2022, Hesketh et. al
The left panel is a reprinting of Figure 5C from Hesketh et al., 2022, which is made available under a CC-BY-NC-ND 4.0 International license. Any further reproduction must adhere to the terms of the original license.
© 2022, Lacey et al.
The right panel is a reprinting of Figure 4C from Lacey et al., 2022, which is made available under a CC-BY-NC-ND 4.0 International license. Any further reproduction must adhere to the terms of the original license.
Figure 4—video 1. Fitting monomeric IFT-A into the anterograde train cryo-ET structure.
Download video file (542KB, mp4)