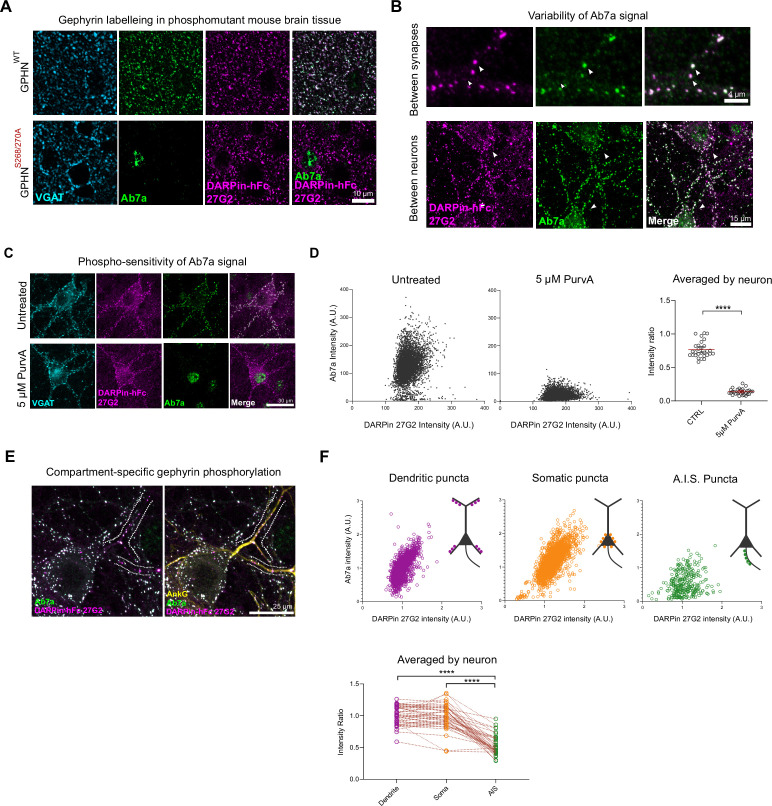
Figure 3. Phospho S270-insensitive DARPin-hFc 27G2 multiplexed with antibody Ab7a can assess synapse-specific gephyrin S270 phosphorylation.
(A) Representative images of DARPin-hFc 27G2 (but not antibody Ab7a) labeling gephyrin puncta in both wildype (WT) and phospho-mutant gephyrin S268A/S270A mutant mouse brain tissue (somatosensory cortex layer 2/3). (B) Representative images from hippocampal neuron culture showing the relative Ab7a signal (indicating S270 phosphorylation) varies by synapse and between neurons. (C) Representative image showing DARPin-hFc 27G2 binding at synaptic puncta in primary hippocampal neuron culture is preserved after inhibition of CDKs following 24 hr treatment with 5 µM aminopurvalanol (PurvA) while Ab7a staining is severely reduced. (D) The relative fluorescence intensity at individual synapses (pooled from 30 neurons per group) showing a pronounced decrease in the average Ab7a/DARPin-hFc 27G2 intensity ratio. Quantification of Ab7a/DARPin-hFc 27G2 fluorescence signal averaged across cells pooled from three independent experiments, n = 30 cells/group. (E) Representative images of hippocampal neuron culture used for quantification of relative Ab7a/DARPin-hFc labeling of clusters on the soma, proximal dendrites, or the axon-initial segment (A.I.S.) (AnkG). (F) Ab7a/DARPin intensity ratio of individual synapses pooled from 45 cells over three independent experiments showing a decrease in A.I.S. cluster Ab7a staining. Lower: quantification indicates significantly reduced A.I.S. Ab7a labeling of clusters compared to dendritic or somatic compartments. Statistics: (D) one-way ANOVA; (F) repeated-measures one-way ANOVA. All panels: *p<0.05, **p<0.01, ***p<0.001, ****p<0.0001. Mean and SD are presented.
Figure 3—figure supplement 1. Structure of DARPin-hFc 27G2.

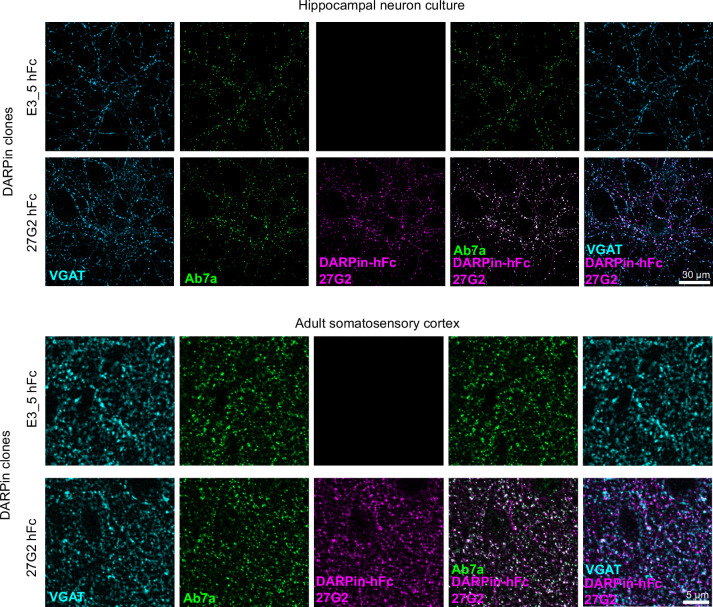
Figure 3—figure supplement 2. Validation of DARPin-hFc 27G2 for immunostaining.
Figure 3—figure supplement 3. Competition with recombinant gephyrin reduces DARPin-hFc reactivity in tissue.
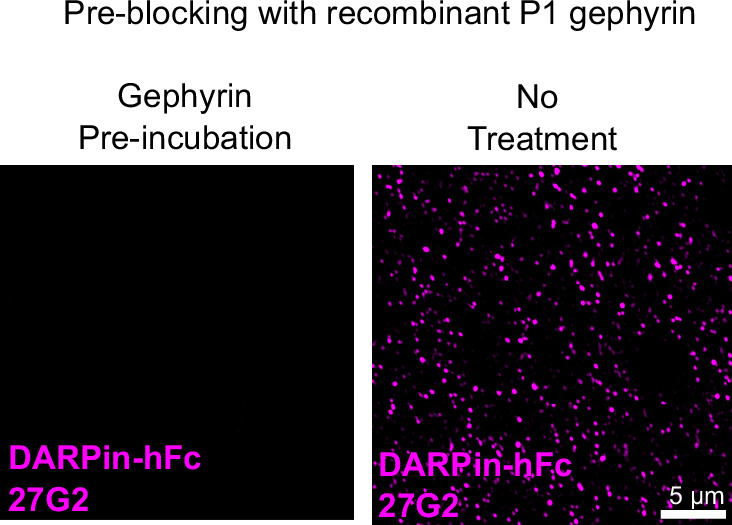
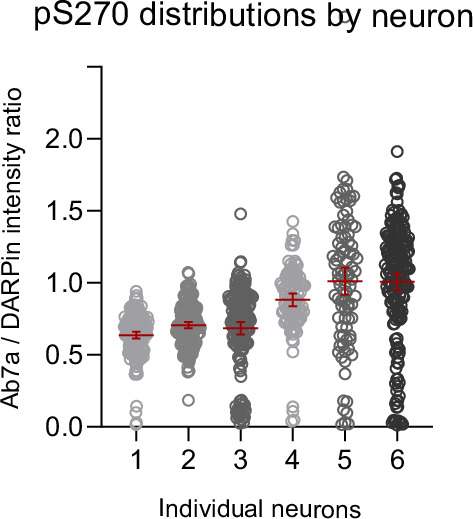
Figure 3—figure supplement 4. Variation in Ab7a reactivity.
