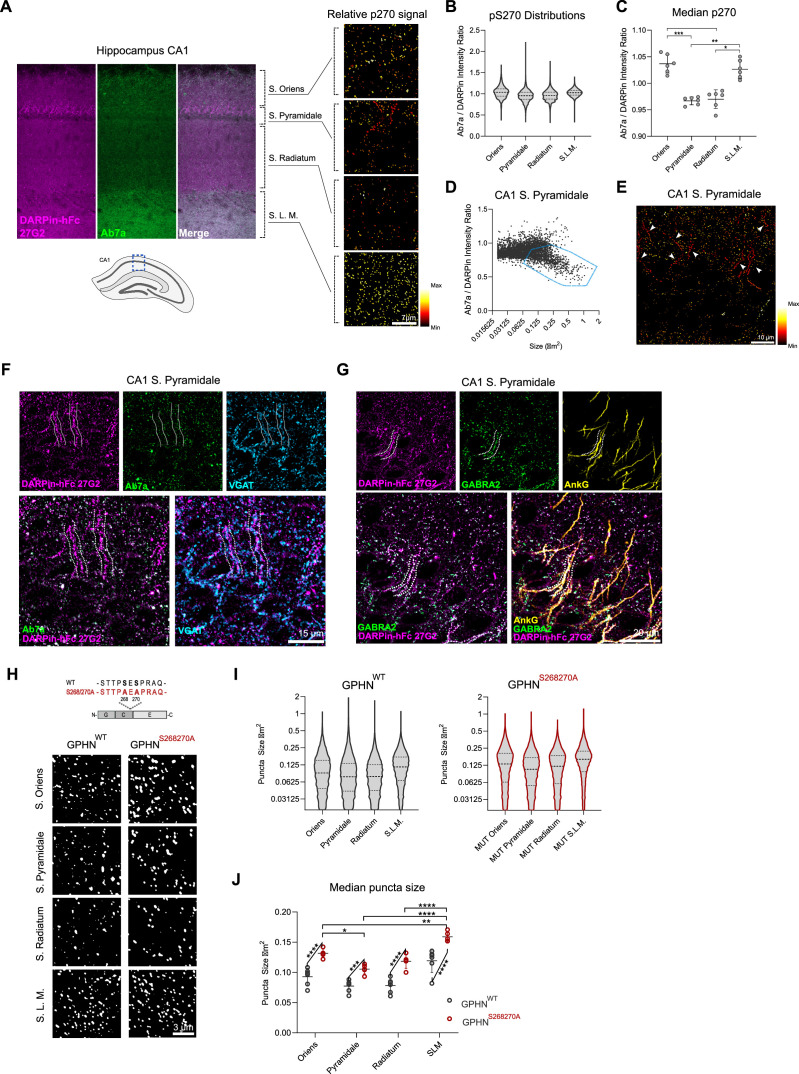
Figure 4. DARPin-hFc 27G2 labeling of gephyrin clusters demonstrates laminar and axon-initial segment (A.I.S.)-specific S270 phosphorylation and phosphorylation-dependent cluster size regulation.
(A) Left: the relative Ab7a to DARPin-hFc 27G2 fluorescence intensity in the mouse hippocampus area CA1 shows layer-specific variability. Right: colorized gephyrin puncta indicating relative S270 phosphorylation as seen from hotter (more red/yellow) coloration. (B) Distribution of relative gephyrin phosphorylated at S270 (p270) at puncta between hippocampal lamina. Data pooled between six adult mice, three sections analyzed per mouse encompassing 14,000–47,000 gephyrin puncta per layer. (C) Analysis of the median relative gephyrin pS270 ratio between hippocampal layers (data pooled between sections per mouse, n = 6 mice quantified). (D) Example distribution of gephyrin pS270 signal by puncta size in the CA1 stratum pyramidale, with a population of large, hypophosphorylated clusters outlined. (E) Representative image of s. pyramidale with hot colors indicating gephyrin clusters with elevated phosphorylation; arrows indicate trains of large hypophosphorylated clusters. (F) Representative image showing large DARPin-identified gephyrin clusters apposed to presynaptic VGAT-containing terminals with corresponding low Ab7a antibody signal. (G) Representative image indicating gephyrin clusters on the A.I.S. (AnkG) colocalize with the α2 GABAA receptor subunit. (H) Representative images of gephyrin puncta identified using cluster analysis software in WT and S268A/S270A phospho-null mutant mice in the hippocampus using identical imaging parameters. (I) Violin plots indicating the distribution of gephyrin puncta sizes (14,000–47,000 puncta per group, pooled across 5–6 mice per group). (J) Analysis of the median puncta size between hippocampal layers and genotypes indicating larger gephyrin clusters in mutant mice. Statistics: (C) one-way ANOVA, (J) mixed-effects analysis comparing hippocampal lamina (horizontal bars) and genotypes (angled bars). All panels: *p<0.05, **p<0.01, ***p<0.001, ****p<0.0001. Median and SD are presented.
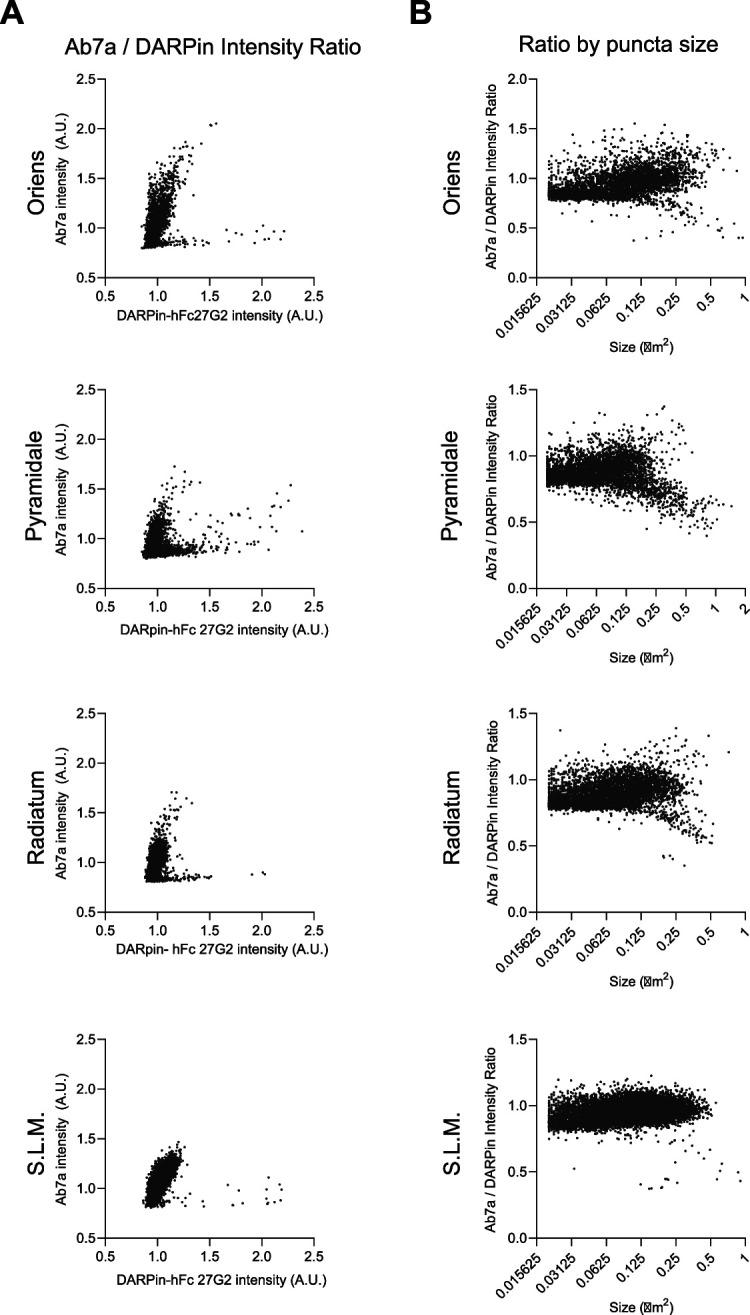
Figure 4—figure supplement 1. Relative pS270 synaptic distribution in the hippocampal CA1.


