. 2022 Oct 31;11:e80895. doi: 10.7554/eLife.80895

Figure 5. A DARPin-based consensus gephyrin interactome captures both known and novel protein interactors.

A) Mouse brain tissue lysate preparation diagram. (B) Liquid chromatography tandem mass spectrometry (LC-MS/MS) and interactome determination methodology workflow indicating thresholds for consideration of interacting proteins. (C) Scale-free interaction networks (STRING) of gephyrin interactors identified from pulldowns using the commercial antibody 3B11, or DARPin-hFc 27B3, 27F3, and 27G2 compared to control conditions (containing antibody control IgG or the control DARPin-hFc E3_5). Nodes represent unique gephyrin interactors – red nodes indicate known (canonical) gephyrin interactors. (D) Venn diagram of the overlap in identified interactors from gephyrin complexes isolated using different DARPin-hFc clones; bottom indicates coverage compared to an extensive gephyrin interactome determined using BioID labeling (Uezu et al., 2016) and 22 canonical gephyrin interactors identified from the literature. (E) Consensus interactome of proteins identified by all DARPin-hFc clones and colored by protein ontology. Canonical gephyrin interacting proteins are indicated by blue font, and bold font indicates interactors also identified by the antibody clone 3B11. Asterisks indicate proteins previously identified by BioID (Uezu et al., 2016). Italic font indicates interactors exclusively identified by DARPins. Edges connecting protein nodes indicate putative interactions (STRING analysis), and node circle size indicates relative protein abundance averaged across all experiments.

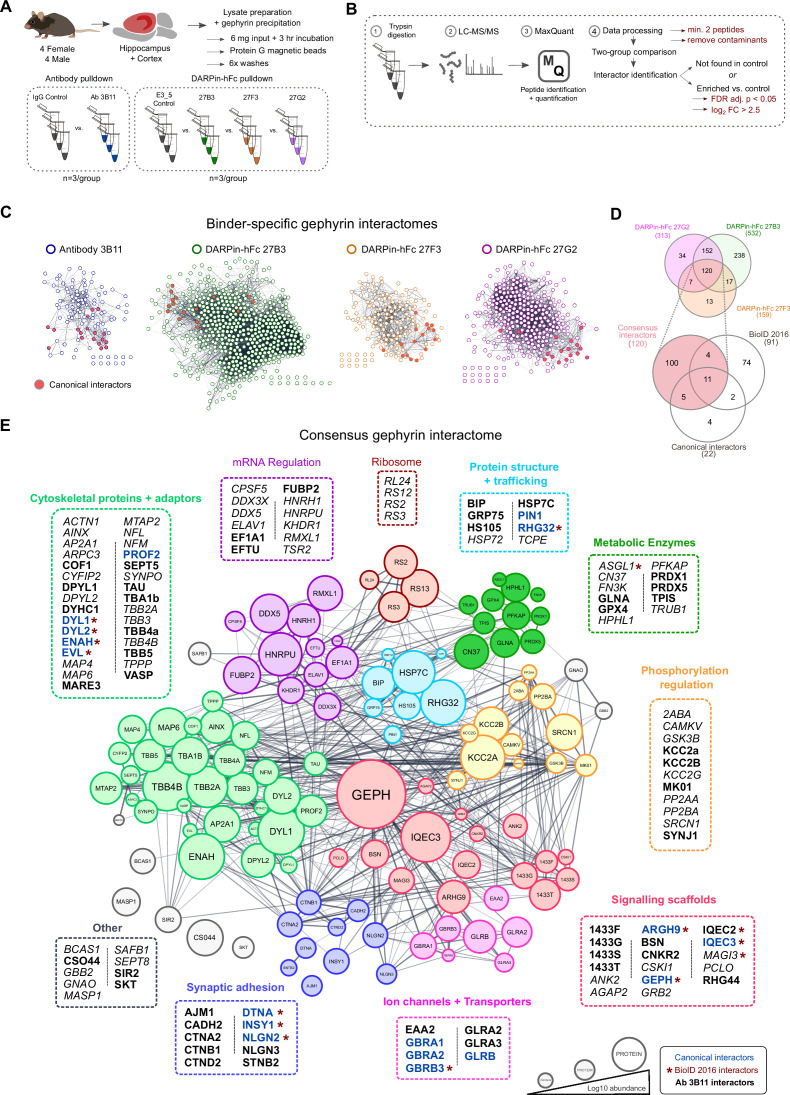
Figure 5—source data 1. List of interactors and relative abundance of detected proteins used to construct interaction networks and Venn diagrams in Figure 5C–E.

Figure 5.

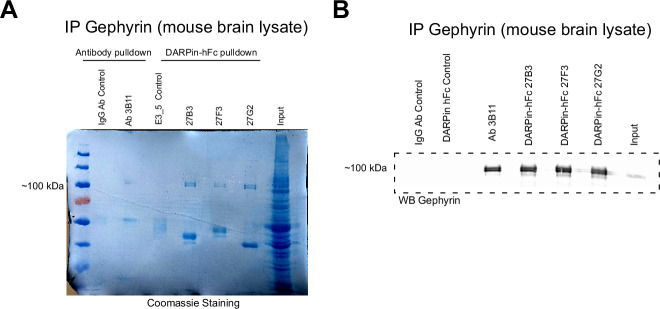
Figure 5—figure supplement 1. Anti-gephyrin DARPins affinity purify gephyrin from mouse brain lysates.

Figure 5—figure supplement 1.

(A) Coomassie-stained acrylamide gel indicating abundant gephyrin precipitated both by the antibody 3B11 and DARPin-hFc 27B3, 27F3, and 27G2 without signal in antibody (IgG) or DARPin (E3_5) controls. Lower bands correspond to IgG or DARPin-hFc protein. (B) Immunoblot of gephyrin precipitated with different binders probed with the antibody 3B11.
Figure 5—figure supplement 1—source data 1. Raw Coomassie gel images and immunoblots from Figure 5—figure supplement 1.
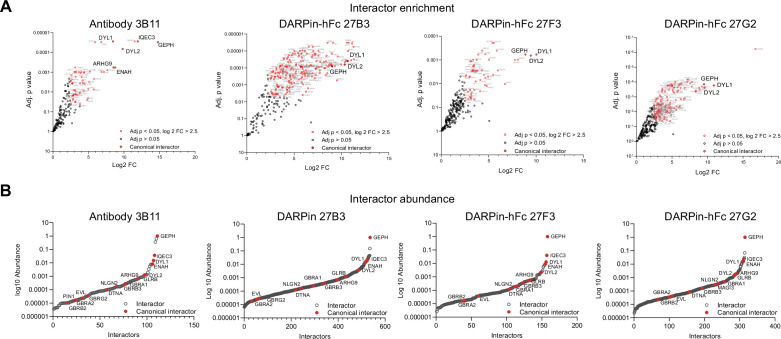
Figure 5—figure supplement 2. Interactor identification plots.

Figure 5—figure supplement 2.

(A) Volcano plots of enriched proteins with the Log2 FC > 2.5 and false discovery rate (FDR)-adjusted p-value compared to controls. Red points indicate identified gephyrin interacting proteins, with canonical interactors indicated by enlarged text. (B) Abundance of gephyrin interactors for antibody and DARPin-hFc experiments with canonical interactors indicated in red demonstrating several orders of magnitude difference interactors.
Figure 5—figure supplement 2—source data 1. Identity and quantification of abundance of interacting proteins presented in Figure 5—figure supplement 2.
Figure 5—figure supplement 2—source data 2. Compiled list of proteins from all gephyrin interactor experiments used to assess gephyrin interactor identity.
Figure 5—figure supplement 3. Interactome overlap with previous literature.

Figure 5—figure supplement 3.

Venn diagrams showing the overlap in identified interactors determined using both antibody and DARPin-based interactomes compared to previously identified interactors from the literature (see ‘Materials and methods’) and BioID (Uezu et al., 2016).
Figure 5—figure supplement 4. Ontological enrichment analysis of the consensus gephyrin interactome.

Figure 5—figure supplement 4.

Biological process enrichment (WebGestalt) for the 120 consensus gephyrin interactors showing significantly regulated ontologies.