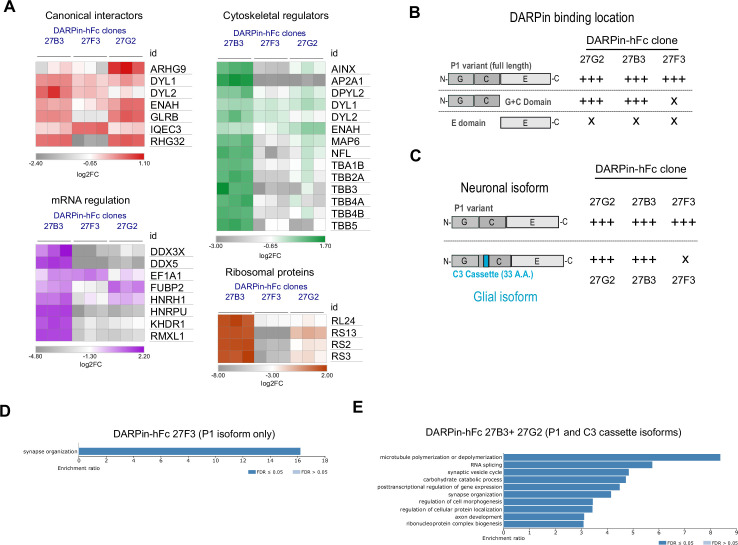
Figure 6. Diversity in DARPin-hFc clone-specific interactomes reveals putative isoform-specific gephyrin interactors.
(A) Canonical and non-canonical (metabolic, mRNA binding, and ribosomal ontology) gephyrin interactors show binder-specific abundance profiles. Only significantly regulated interactors are shown. (B) DARPin-hFc clones 27B3 and 27G2 recognize both full-length gephyrin and the GC-domain while clone 27F3 recognizes only full-length gephyrin suggesting different binding epitopes. (C) DARPin-hFc 27F3 only recognizes the principal P1 (synaptic) isoform of gephyrin while clones 27B3 and G2 additionally recognize non-neuronal isoforms containing the C3 cassette. (D) DARPin-hFc 27F3-determined gephyrin interactome enriched over-representation analysis of biological processes. (E) DARPin-hFc 27B3 and 27G2-determined gephyrin interactome enriched over-representation analysis of biological processes. Statistics: (A) two-way ANOVA with multiple-comparisons correction comparisons all groups, three replicates per group.
Figure 6—figure supplement 1. DARPin-specific gephyrin interactor abundance.
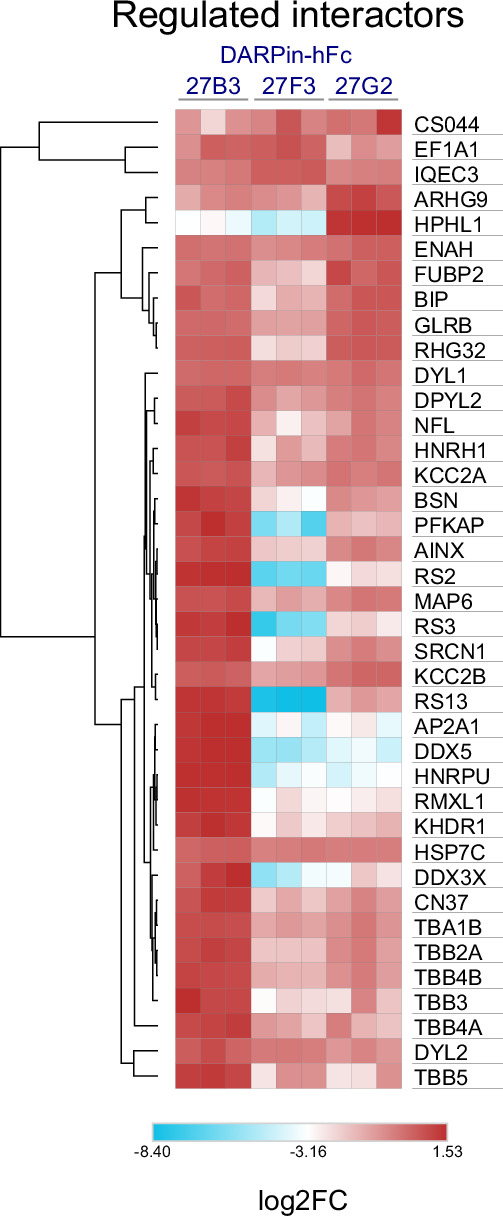
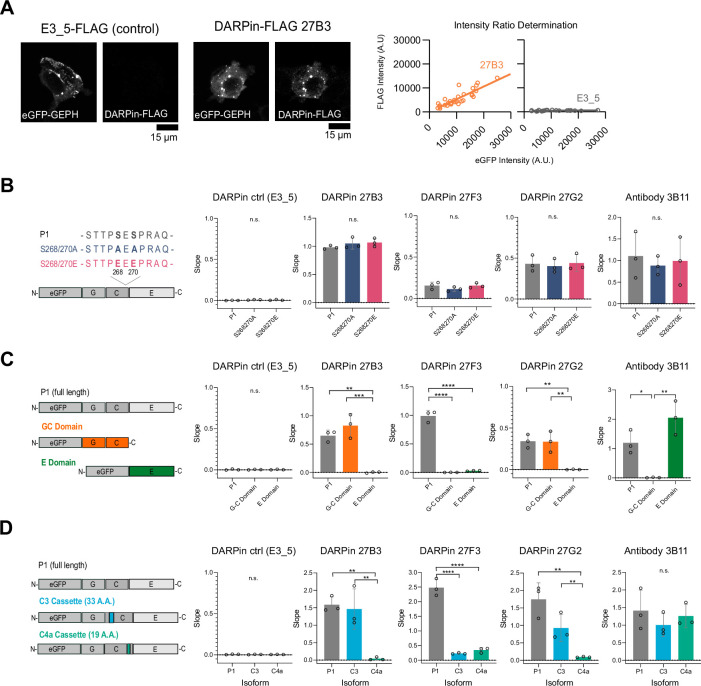
Figure 6—figure supplement 2. Identification of gephyrin-binding preferences of anti-gephyrin DARPins using an in-cell HEK293T fluorescence assay.
Figure 6—figure supplement 3. Non-neuronal interactor ontology.
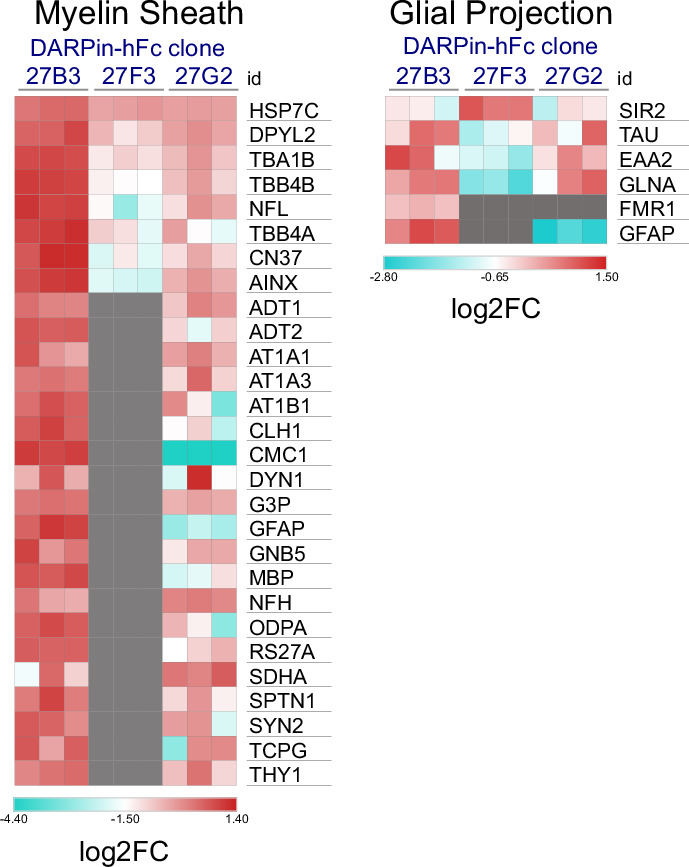
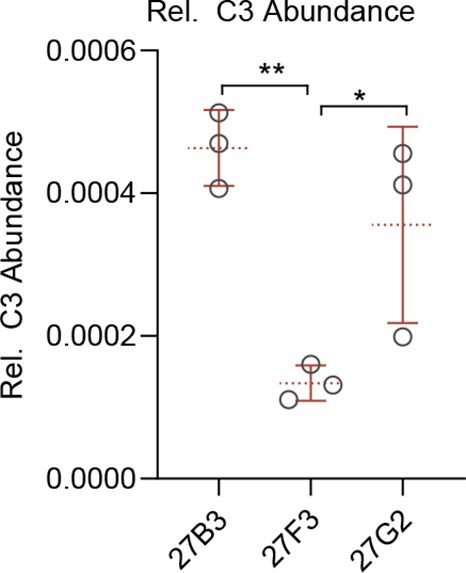
Figure 6—figure supplement 4. Relative C3 cassette recovery.
