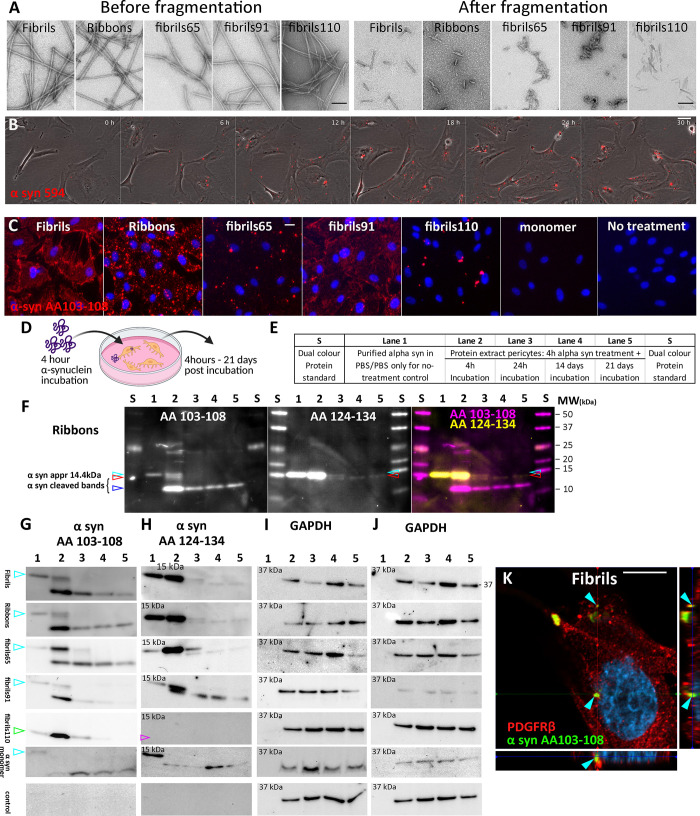
Fig 1. Internalisation and degradation of α-syn strains in pericytes.
(A) Electron microscopy of α-syn strains before and after fragmentation. (B) Live cell imaging of fluorescently tagged α-syn for 30 hours. (C) Immunofluorescent labelling of α-syn strains after 30 min in control pericytes with α-syn epitope-specific antibody AA103-108. (D) Schematic representation of experimental setup. (E) Loading of western blots. Lane 1 only contains pure α-syn aggregate, whereas lane 2–5 shows α-syn isolated from pericytes. (F) Detailed fluorescent western blot with α-syn epitope-specific antibodies detecting Ribbons with α-syn antibody AA103-108 (magenta), AA124-134 (yellow) and merge showing overlap of α-syn bands. Various bands are identified indicating full length (14.4kDa, cyan arrow) and cleaved α-syn (red and blue arrows). α-syn detection on individual western blots for Fibrils, Ribbons, fibrils65, fibrils91, fibrils110 and no-treatment control (PBS) with α-syn epitope specific antibodies showing full length α-syn (cyan arrow) and cleaved α-syn fragments. Fibrils110 lacks a full-length band as aggregate is made up of C-term cleaved α-syn (green arrow). (G) AA 103–108, (H) AA124-134, and (H) GAPDH blot corresponds to blot shown in G after antibody stripping and relabelling. Full blots shown in S1 Raw images. Confocal image with orthogonal views showing pericyte with internalised α-syn Fibrils after 24 hours (cyan arrows, K). Scale bars represent 100 nm (A), 20 μm (B,C), 10 μm (K).

