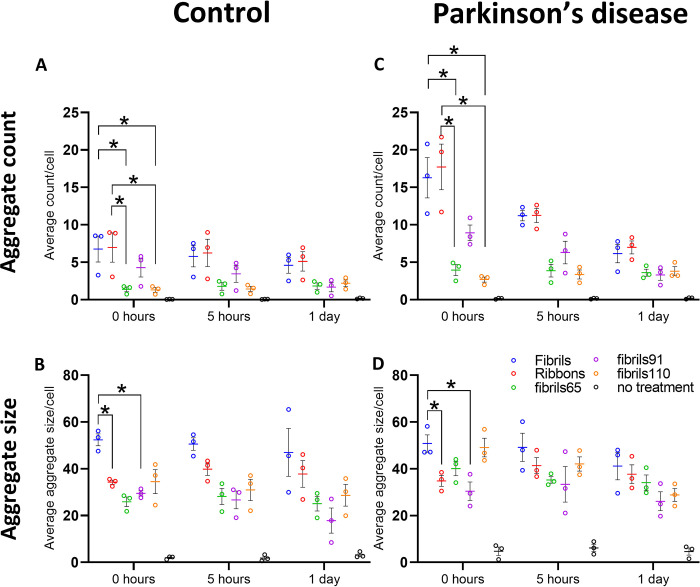
Fig 4. Strain-specific differences in control and PD-derived post-mortem pericytes.
(A-B) Average aggregate count/cell analysis and (C-D) average aggregate size/cell analysis based on AA103-108 for control pericytes (n = 3) and PD pericytes (n = 3). Two-way ANOVA was used with Tukey’s post hoc adjustment for multiple comparisons. An asterisk indicates significant differences in control and PD-derived post-mortem pericytes * (p<0.05).

