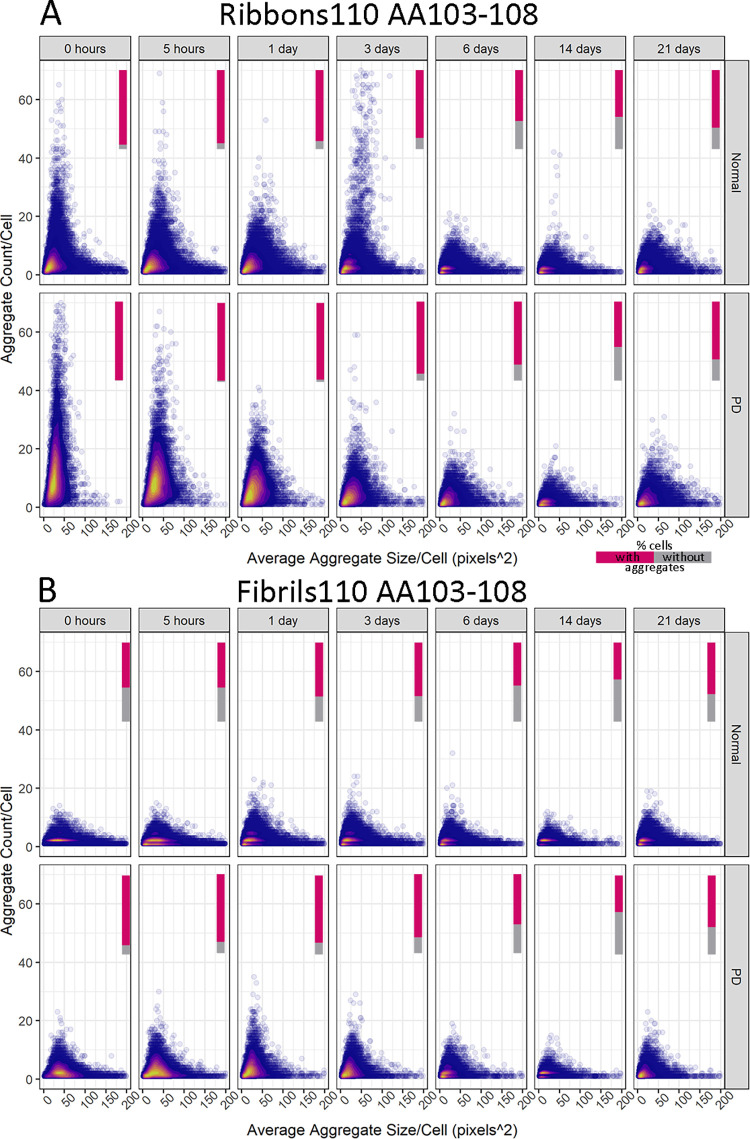
Fig 5. Density plots showing a differential response to α-syn aggregates for control and PD-derived pericytes based on AA103-108 for Ribbons and fibrils 110.
Cells without aggregates are excluded from density plots. Relative amounts of cells with aggregates are represented in a bar (% cells with aggregates in magenta, % cells without aggregates in grey).

