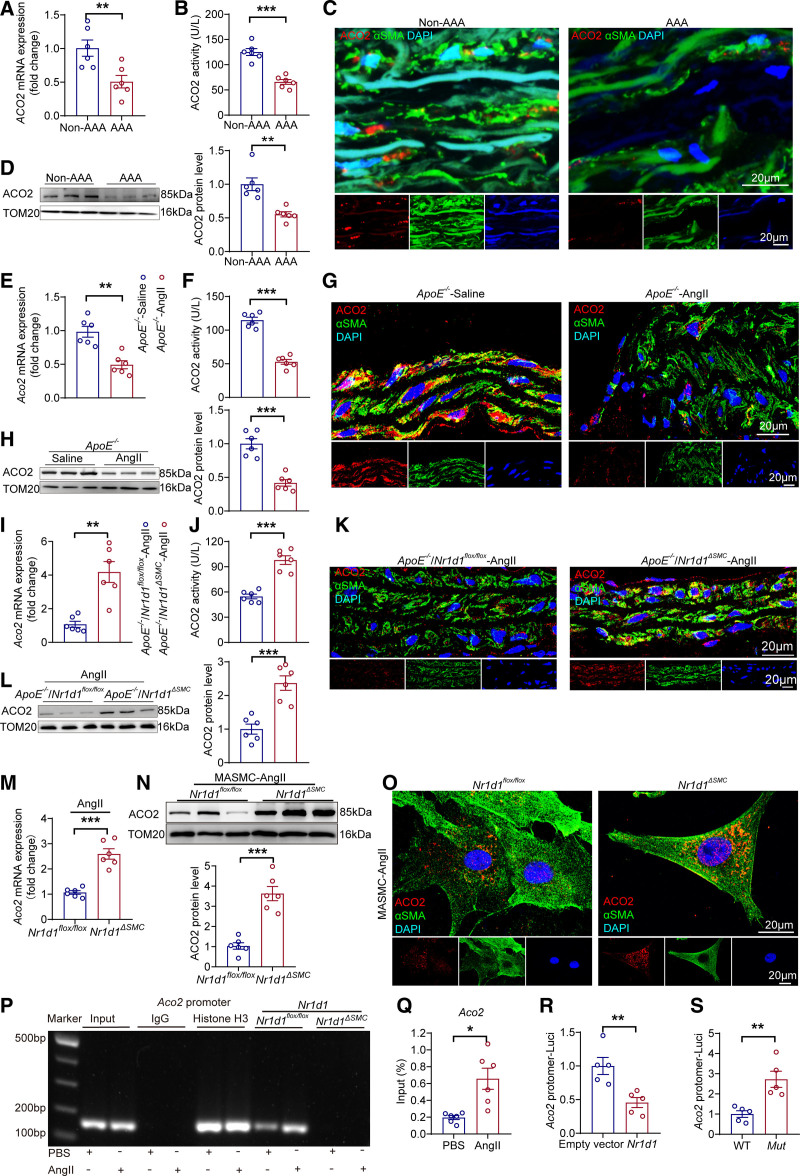
Figure 4.
Aco2 is the direct trans-repression target of NR1D1 in regulating mitochondrial function. A and B, Aco2 mRNA expression and ACO2 activity measured by RT-qPCR and ELISAs in human AAA and non-AAA segments (n=6 per group). Data were analyzed by Student t test. **P<0.01; ***P<0.001. C, Representative images of ACO2 expression by immunofluorescence staining of human AAA and non-AAA segments and costaining with the key smooth muscle cell–associated marker αSMA and DAPI. D, Left, ACO2 protein expression assessed by Western blot in human AAA and non-AAA segments. Right, Quantification of ACO2 protein expression measured by Western blot in indicated groups (n=6 per group). Data were analyzed by Student t test. **P<0.01. E and F, Aco2 mRNA expression and ACO2 activity measured by RT-qPCR and ELISAs in abdominal aortic segments from saline- and AngII-infused ApoE−/− mice (n=6 per group). Data were analyzed by Student t test. **P<0.01; ***P<0.001. G, Representative images of ACO2 expression by immunofluorescence staining in abdominal aortas from saline- and AngII-infused ApoE−/− mice. H, Left, ACO2 protein expression measured by Western blot in abdominal aortas from saline- and AngII-infused ApoE−/− mice. Right, Quantification of ACO2 protein expression measured by Western blot in indicated groups (n=6 per group). Data were analyzed by Student t test. ***P<0.001. I and J, Aco2 mRNA expression and ACO2 activity measured by RT-qPCR and ELISAs in abdominal aortas from AngII-infused ApoE−/−/Nr1d1flox/flox and ApoE−/−/Nr1d1ΔSMC mice (n=6 per group). Data were analyzed by Student t test. **P<0.01; ***P<0.001. K, Representative images of ACO2 expression by immunofluorescence staining in abdominal aortas from AngII-infused ApoE−/−/Nr1d1flox/flox and ApoE−/−/Nr1d1ΔSMC mice. L, Left, ACO2 protein expression measured by Western blot in abdominal aortas from AngII-infused ApoE−/−/Nr1d1flox/flox and ApoE−/−/Nr1d1ΔSMC mice. Right, Quantification of ACO2 protein expression measured by Western blot in indicated groups (n=6 per group). Data were analyzed by Student t test. ***P<0.001. M, Aco2 mRNA expression measured by RT-qPCR in MASMCs isolated from Nr1d1flox/flox and Nr1d1ΔSMC mice after stimulation with AngII for 48 h (n=6 independent experiments). Data were analyzed by Student t test. ***P<0.001. N, Top, Mitochondrial ACO2 protein expression measured by Western blot in MASMCs isolated from Nr1d1flox/flox and Nr1d1ΔSMC mice after stimulation with AngII for 48 hours. Bottom, Quantification of ACO2 protein expression measured by Western blot in indicated groups (n=6 independent experiments). Data were analyzed by Student t test. ***P<0.001. O, Representative images of ACO2 expression by immunofluorescence staining in MASMCs isolated from Nr1d1flox/flox and Nr1d1ΔSMC mice after stimulation with AngII for 48 hours. P, ChIP-qPCR was performed with antibodies to NR1D1, and the target promoter region of Aco2 was amplified by qPCR. Q, Quantification of ChIP-qPCR (n=6 independent experiments). Data were analyzed by Student t test. *P<0.05. R, MASMCs were cotransfected with empty or Nr1d1 plasmid and pGL3-Aco2-promoter-Luci plasmid for 48 hours (n=5 independent experiments). Data were analyzed by Student t test. **P<0.01. S, MASMCs were cotransfected with Nr1d1 plasmid and pGL3-m_wtAco2-promoter-Luci (WT) or pGL3-m_mutAco2-promoter-Luci plasmid (Mut) for 48 hours (n=5 independent experiments). Data were analyzed by Student t test. **P<0.01. Data are expressed as mean ± SEM. AAA indicates abdominal aortic aneurysm; ACO2, aconitase-2; AngII, angiotensin II; ChIP, chromatin immunoprecipitation; MASMCs, mouse aortic smooth muscle cells; NR1D1, nuclear receptor subfamily 1 group D member 1; RT-qPCR, real-time quantitative polymerase chain reaction; and WT, wild type.

