Figure 1.
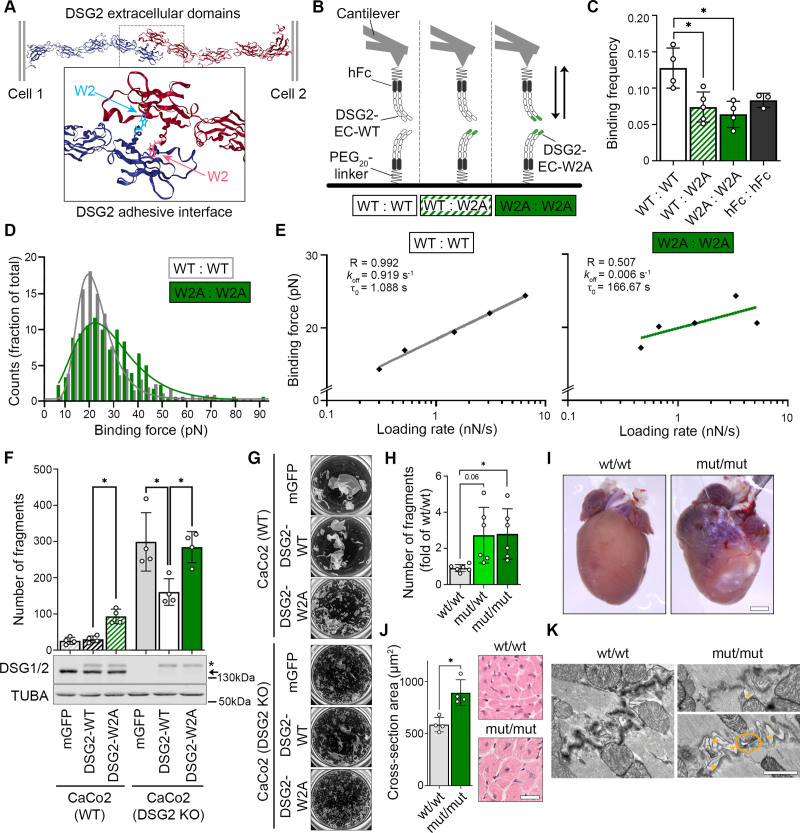
DSG2 (desmoglein-2) adhesion is mediated by tryptophan swap at position 2. A, Predicted interaction model of DSG2 extracellular domains by exchange of tryptophan residue at position 2 into a hydrophobic pocket of the opposing molecule. Cartoon 3D presentation of Protein Data Bank entry 5ERD9; tryptophan-2 is highlighted by ball and stick presentation. B, Schematic of single molecule force spectroscopy experiments. Recombinant extracellular domains (ECs) of wild-type DSG2 (DSG2-WT) or mutant DSG2 (DSG2-W2A) protein were coupled to a mica surface and atomic force microscopy cantilever by mean of a human Fc-tag (hFc) and a polyethylene glycol (PEG)20 linker and probed as indicated. C, Binding frequency of DSG2-W2A/DSG2-WT heterotypic and homotypic interactions at a pulling speed of 2 µm/s are shown. hFc served as control for nonspecific binding. *P<0.05, 1-way analysis of variance, Dunnett post hoc test. Each independent coating procedure with minimum 625 force curves is taken as biological replicate. D, Histogram of binding forces distribution with peak fit at a pulling speed of 2 µm/s corresponding to data in C. E, Determination of the bond half lifetime by the Bell equation11 of mean loading rates and binding forces analyzed from data of pulling speeds at 0.5, 1, 2, 5, and 7.5 µm/s. Average of values from 4 independent coating procedures with minimum 625 force curves each. R=R2, koff =off-rate constant, τ0=bond half lifetime under zero force. F, Dissociation assays to determine cell–cell adhesion were performed in CaCo2 cells (WT or DSG2 KO background) expressing DSG2-WT-mGFP or DSG2-W2A-mGFP constructs. mGFP empty vector served as control. *P<0.05, 1-way analysis of variance, Sidak post hoc test. Corresponding Western blot analysis confirmed effective expression of DSG2 constructs (*) versus the endogenous protein (arrow) in CaCo2 cells. α-tubulin (TUBA) served as loading control. G, Representative images of monolayer fragmentation from experiments in F. H, Dissociation assays in immortalized keratinocytes isolated from neonatal murine skin of the respective genotype. *P<0.05 or as indicated, Welch analysis of variance, Dunnett post hoc test. I, Macroscopic cardiac phenotype of DSG2-W2A mut/mut mice at age 15 weeks. J, Cardiac hypertrophy was analyzed as mean cross-sectional area of cardiomyocytes in hematoxylin & eosin–stained sections. Scale bar, 30 µm. *P<0.05, unpaired Student t test. K, Representative images of intercalated discs acquired by transmission electron microscopy, 3 mice per genotype. Orange asterisks mark intercellular widening, orange circle marks a ruptured junction. Scale bar, 1 µm.

