Figure 3.
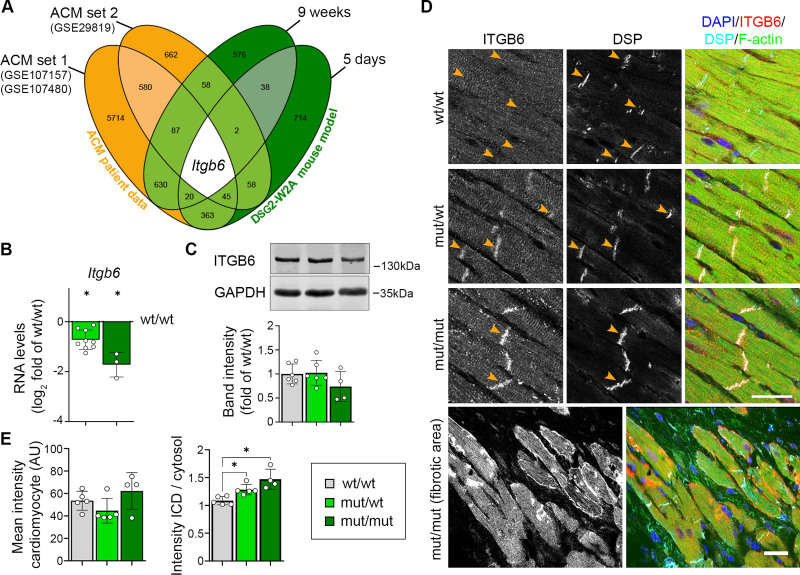
Integrin-β6 is deregulated in DSG2 (desmoglein-2)–W2A mutants. A, Venn diagram of significantly altered genes from indicated arrhythmogenic cardiomyopathy (ACM) patient data sets (ACM versus healthy control) and DSG2-W2A mice at the age of 5 days and 9 weeks (mut/mut versus wt/wt) highlighting integrin-β6 (Itgb6) as only overlapping gene with same direction of expression in all data sets. Numbers indicate the amount of overlapping genes for the respective overlays. B, RNA expression of Itgb6 analyzed by means of reverse transcription quantitative polymerase chain reaction in adult DSG2-W2A mouse hearts. *P<0.05, unpaired Student t test versus wt/wt. Gapdh served as reference gene. C, Representative Western blot and respective analysis of band intensity of integrin-β6 (ITGB6) in DSG2-W2A hearts. GAPDH served as loading control. 1-way analysis of variance, Dunnett post hoc test. D and E, Immunostaining of ITGB6 (red in overlay) in DSG2-W2A hearts with corresponding analysis of staining intensity in cardiomyocytes in total and ratio of staining intensity at the intercalated disc (ICD) area (orange arrowheads) versus cardiomyocytes’ cytosolic area. DSP (desmoplakin; cyan) marks ICDs, DAPI (blue) nuclei and F-actin (green) the sarcomere system. Lower row shows an overview image of a fibrotic area in mut/mut hearts. Scale bars, 25 µm. *P<0.05; left graph: Kruskal-Wallis test with Dunn post hoc test; right graph: 1-way analysis of variance, Dunnett post hoc test. Box with color indications of respective groups applies to the entire figure.

