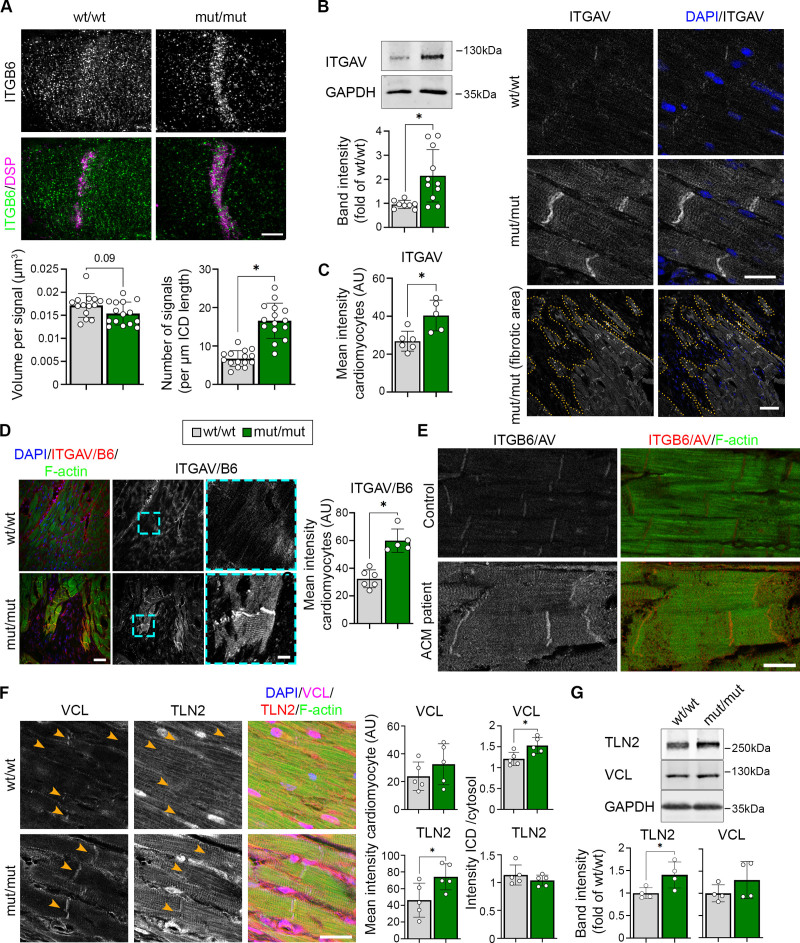
Figure 5.
Increased activation of ITGB6/AV at ICDs of DSG2 (desmoglein-2)–W2A mutant mice. A, Representative intercalated disc (ICD) reconstruction from z-stacks of integrin-β6 (ITGB6; green) and DSP (magenta) immunostaining acquired by structured illumination microscopy and presented as maximum intensity projection. Related analysis of ITGB6 signal volume and number per ICD length is shown below. Scale bar, 5 µm. *P<0.05 or as indicated, unpaired Student t test with Welch correction (left graph) and Mann-Whitney test (right graph). Each dot represents the value of 1 ICD from in total 4 mice per genotype. B, Representative Western blot and analysis of band intensity of integrin-αV (ITGAV) in DSG2-W2A hearts. GAPDH served as loading control. *P<0.05, unpaired Student t test with Welch correction. C, Immunostaining of ITGAV in DSG2-W2A hearts on the right with respective analysis on the left. DAPI (blue) marks nuclei. Lower row shows an overview image of a fibrotic area in mut/mut hearts. Dotted orange line marks the edge of fibrotic area. Scale bars: upper rows, 20 µm; lower row, 50 µm. *P<0.05, unpaired Student t test. D, Immunostaining of ITGAV/B6 heterodimer in DSG2-W2A mutant hearts with respective analysis of staining intensity on the right. Cyan rectangle marks zoomed area on the right. Scale bars: overview, 50 µm; insert, 10 µm. *P<0.05, unpaired Student t test. E, Representative immunostaining images of ITGAV/B6 heterodimer staining (red) in a patient with arrhythmogenic cardiomyopathy (ACM; DSP-E952X, heterozygous) and healthy control sample. F-actin (green) stains the sarcomere system. For the patient with ACM, 4 different tissue samples were analyzed and compared with 2 tissue samples from 2 healthy controls. Scale bar, 20 µm. F, Immunostaining of VCL (vinculin; magenta) and TLN2 (talin-2; red) in DSG2-W2A hearts on the right with respective analysis of the mean staining intensity in cardiomyocytes and ratio of the staining intensity at the ICD versus cytosolic area on the left. DAPI (blue) marks nuclei. F-actin (green) stains the sarcomere system. Scale bar, 25 µm; *P<0.05, unpaired Student t test. G, Representative Western blot and analysis of band intensity of VCL and TLN2 in DSG2-W2A hearts. GAPDH served as loading control. *P<0.05, unpaired Student t test for TLN2, Mann-Whitney test for VCL. Box with color indications of respective groups applies to the entire figure.

