
Figure 5.
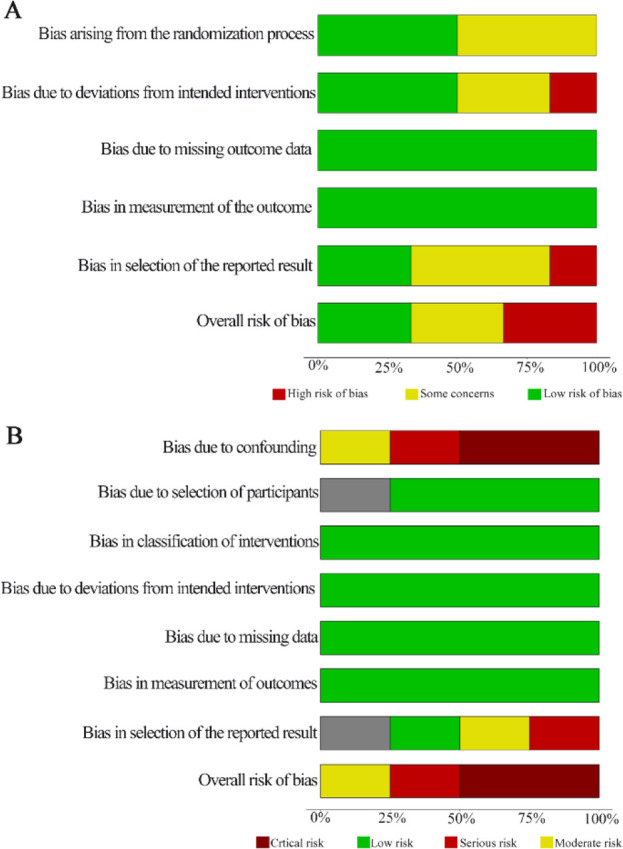
Graph summaries of risk of bias. A) ROB 2.0 results for RCTs. B) ROBINS-I results for NRSIs.
RCTs: Randomized controlled trials; NRSIs: Non-randomized studies of interventions
Official websites use .gov
A
.gov website belongs to an official
government organization in the United States.
Secure .gov websites use HTTPS
A lock (
) or https:// means you've safely
connected to the .gov website. Share sensitive
information only on official, secure websites.
Graph summaries of risk of bias. A) ROB 2.0 results for RCTs. B) ROBINS-I results for NRSIs.
RCTs: Randomized controlled trials; NRSIs: Non-randomized studies of interventions