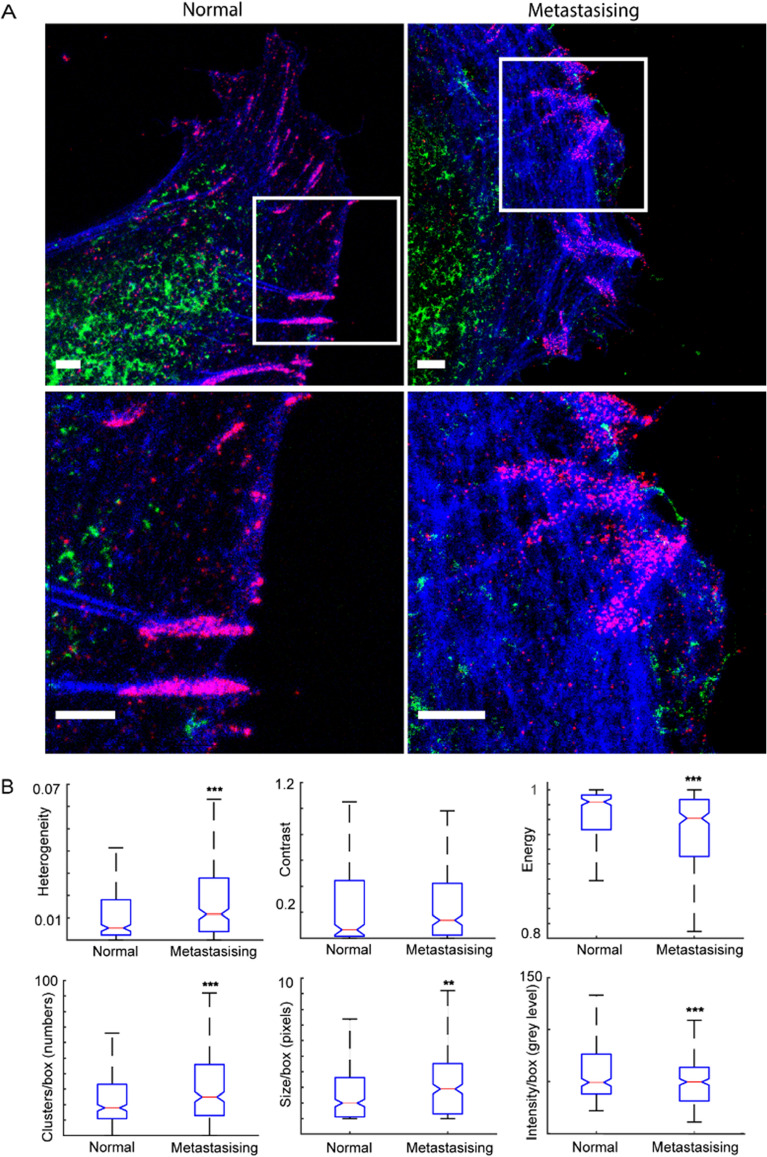
Figure 2.
Nanoscale hyaluronan distribution in normal and invasive fibroblasts. (A) top panel, spatial distribution of hyaluronan (green), phosphotyrosines (red) and F-actin (blue) in control Bjhtert (left) and Bj-invasive (right) cells; lower panel, magnified boxed areas. (B) Notched box plots of hyaluronan features, thin red line showing median values. *** and ** indicates p < 0.001 and p < 0.01, respectively. Scale bars indicate 2 µm.

