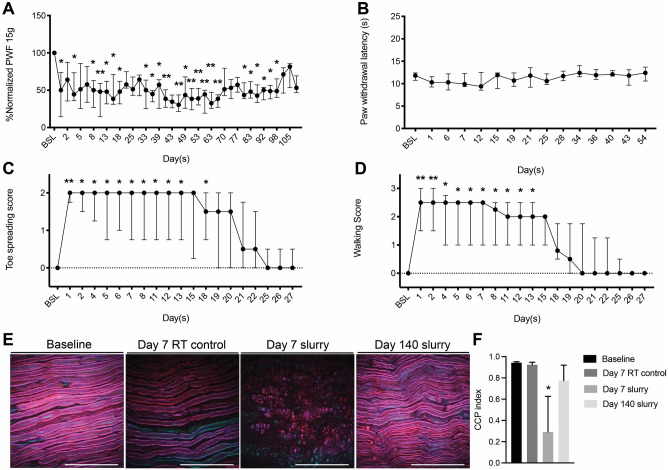
Figure 2.
Slurry shows rapid onset reduction in nerve function (A) Paw withdrawal frequency in response to stimulation with 15 g VFH force at different time points post slurry injection. (B) Effects of slurry injection on paw withdrawal latency in response to heat stimulation in treated hind limbs. (C) Toe spread and (D) walking scores of hind limbs treated with slurry. Data are presented as median with interquartile range. n = 9; * P < 0.05, ** P < 0.001 compared to baseline values by Friedman test followed by Dunn’s multiple comparisons test. (E) CARS microscopy images show myelin and nerve structure in sciatic nerve samples after injection of slurry and room temperature control solution. (F) Graph shows CCP index after injection of slurry and room temperature control solution. Data are presented as mean ± SD. n = 4 per group; * P < 0.0001 compared to baseline values by Ordinary one-way ANOVA followed by Tukey's multiple comparisons test; RT: room temperature.

