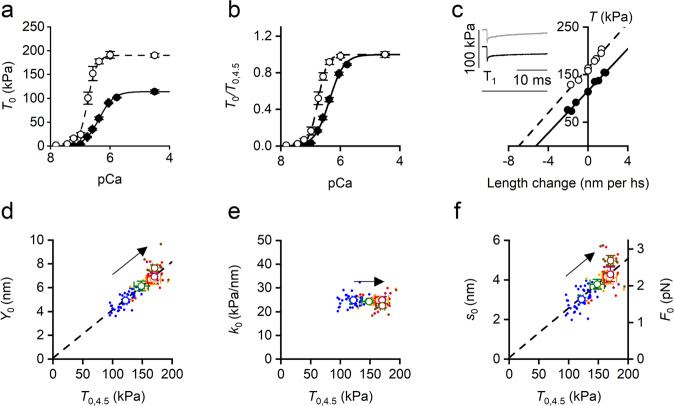
Fig. 2. Effect of temperature on the relevant mechanical parameters of Ca2+-activated skinned soleus fibre.
a Force-pCa relations interpolated with the Hill equation (see SI Methods). Filled circles and continuous line, 12 °C; open circles and dashed line, 35 °C. T0 in absolute units (kPa). b As in a with T0 relative to T0 at pCa 4.5 (T0,4.5). c T1 relations at 12 °C (filled symbols) and 35 °C (open symbols) at pCa 4.5. Lines are first order regression equations fitted to the data at 12 °C (continuous) and 35 °C (dashed). In the inset sample records of the force response to the small step release are superimposed to show the force attained at the end of the step (T1). From top to bottom force at 35 °C, at 12 °C and force baseline. d Dependence on temperature -modulated T0,4.5 of Y0 (half-sarcomere strain) and fit of pooled data with a first order regression equation (dashed line, slope 0.040 ± 0.003 nm/kPa, ordinate intercept 0.10 ± 0.38 nm). e Dependence on T0,4.5 of k0 (half-sarcomere stiffness). f Left ordinate: dependence on T0,4.5 of s0 (motor strain) and linear fit of pooled data (dashed line, slope 0.025 ± 0.003 nm/kPa and ordinate intercept 0.08 ± 0.37 nm). Right ordinate: dependence on T0,4.5 of F0 (motor force). The corresponding parameters of the linear fit are 0.014 ± 0.001 pN/kPa (slope) and 0.04 ± 0.20 pN (ordinate intercept). In d and f the slopes are significantly different from zero (P always <0.005) and the ordinate intercepts are not significantly different from zero (P always >0.75). The arrows in panels d–f indicate the direction of the rise in temperature from 12 to 35 °C; the colours refer to different temperatures: 12 °C, blue; 17 °C, green; 20 °C, red; 25 °C, orange; 30 °C, purple; 35 °C, brown. In a and b, data are mean values (± SEM) from 5 fibres. In c data from one fibre: fibre length, 3.23 mm; length of the segment under the striation follower, 0.72 mm; average sarcomere length, 2.30 μm; CSA, 4210 μm2. In d–f, filled circles are pooled data and open circles the mean values (± SEM) from 31 fibres.

