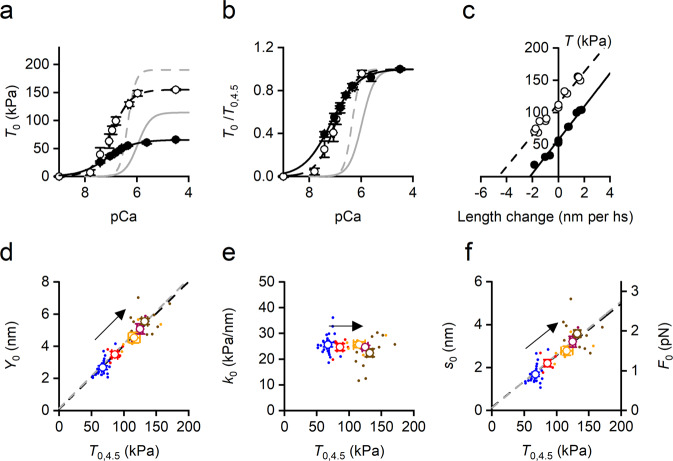
Fig. 3. Effect of temperature on the relevant mechanical parameters of Ca2+-activated skinned soleus fibre in the presence of 1 μM OM.
OM relations (black symbols and lines) are compared with relations in control from Fig. 2 (grey lines). a Force-pCa relations interpolated with the Hill equation at 12 °C (filled circles and continuous line) and 35 °C (open circles and dashed line). T0 in absolute units (kPa). b As in a with T0 relative to T0 at pCa 4.5 (T0,4.5). c T1 relations at 12 °C (filled symbols) and 35 °C (open symbols). Lines are first order regression equations fitted to the data at 12 °C (continuous) and 35 °C (dashed). d Dependence on temperature modulated T0,4.5 of Y0 (half-sarcomere strain,) and fit of pooled data with a first order regression equation (dashed line, slope 0.040 ± 0.003 nm/kPa, ordinate intercept 0.09 ± 0.27 nm). e Dependence on T0,4.5 of k0 (half-sarcomere stiffness). f Left ordinate: dependence on T0,4.5 of s0 (motors strain) and linear fit of pooled data (dashed line, slope 0.024 ± 0.003 nm/kPa and ordinate intercept 0.16 ± 0.26 nm). Right ordinate: dependence on T0,4.5 of F0 (motor force). The corresponding parameters of the linear fit are 0.013 ± 0.001 pN/kPa, slope and 0.08 ± 0.14 pN, ordinate intercept. In d and f the slopes are significantly different from zero (P always <0.005) and the ordinate intercepts are not significantly different from zero (P always >0.5). The arrows indicate the direction of the rise in temperature from 12 to 35 °C; the colours refer to different temperatures: 12 °C, blue; 20 °C, red; 25 °C, orange; 30 °C, purple; 35 °C, brown. In a and b, data are mean values (±SEM) from 7 fibres. In c data from one fibre: fibre length, 4.75 mm; length of the segment under the striation follower, 0.63 mm; average sarcomere length, 2.31 μm; CSA, 2800 μm2. In e and f filled circles are pooled data and open circles the mean values (±SEM) from 17 fibres.

