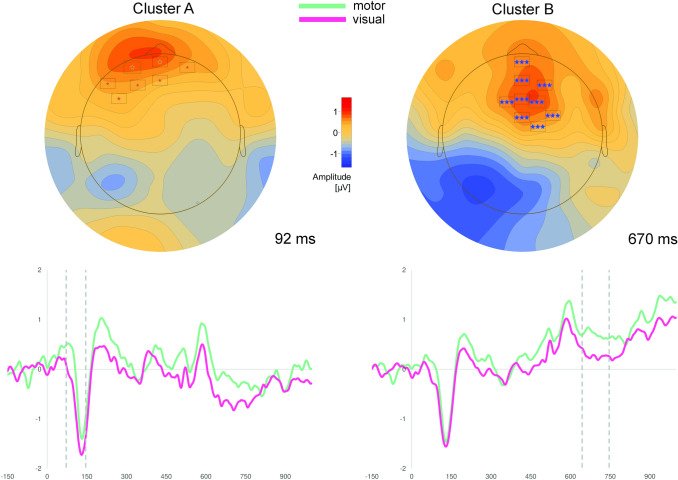
Fig. 3.
Results of cluster permutation tests of Experiment 2. Depicted are clusters, which show significantly more positive scalp potentials for motor compared to visual abstract concepts. Above: Topographic map of each cluster at the time point of the highest t-value across all electrodes. Only electrodes with significant t-values (p < .05) at the specific time point are depicted (for all electrodes see Table 3). Below: ERPs averaged over all electrodes of the respective cluster. Dotted lines indicate the significant time window of the cluster

