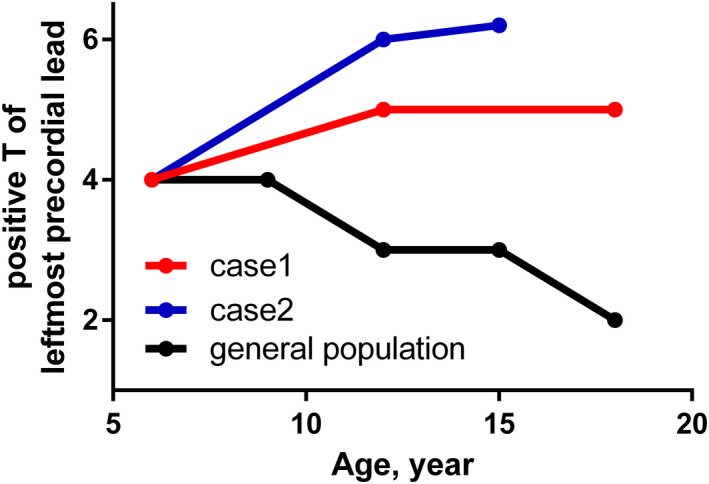
FIGURE 3.

The trend of positive conversion of the T wave in the precordial leads. The age in the horizontal axis and corresponding leftmost lead with positive T wave in the vertical axis were shown. While the physiological positive conversion of T wave, where more than 90% of general cohort show positive T wave, progresses to the right precordial leads in the normal cohort, those in the affected cohort regress with aging
