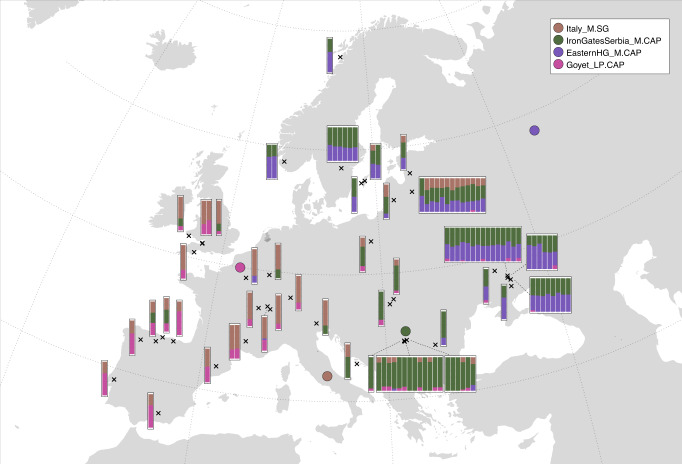
Fig. 2. Spatial distribution of hunter-gatherer ancestry clusters.
Map showing geographic locations (black crosses) and ancestry proportions (bar plots) of post-LGM hunter-gatherers, inferred using qpAdm (Supplementary Data 14). Individuals were modelled using four source groups, representing major post-LGM lineages identified in this and previous studies. Approximate geographic locations of source groups are indicated with coloured symbols.

