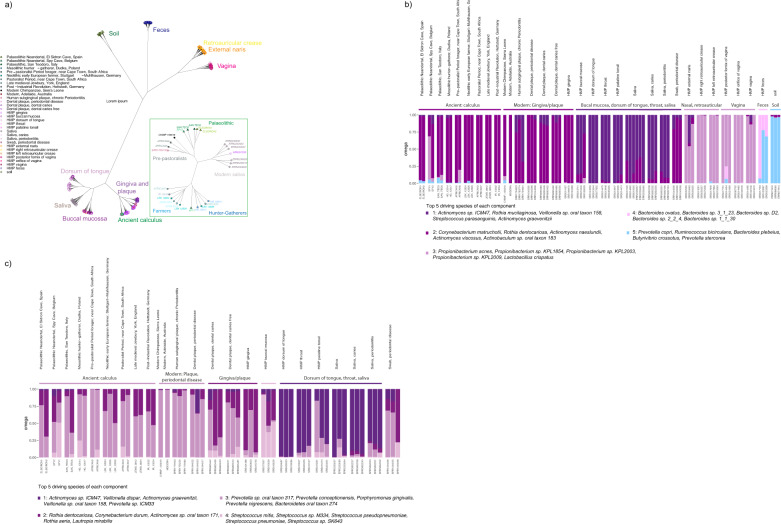
Fig. 4. Clustering of ancient microbiomes.
a Dendrogram showing clustering of microbial composition data using centred log-ratio (CLR) transformed counts and Aitchinson distance, using species set ‘all’. Green inset shows structure among ancient samples only. b Bar plots showing Grade of Membership (GoM) for ancient calculus and selected modern samples for k = 5 components, using species set ‘all’ (Supplementary Data 23). c GoM of oral samples for k = 4 components, using the species set ‘oral’ (Supplementary Data 23).

