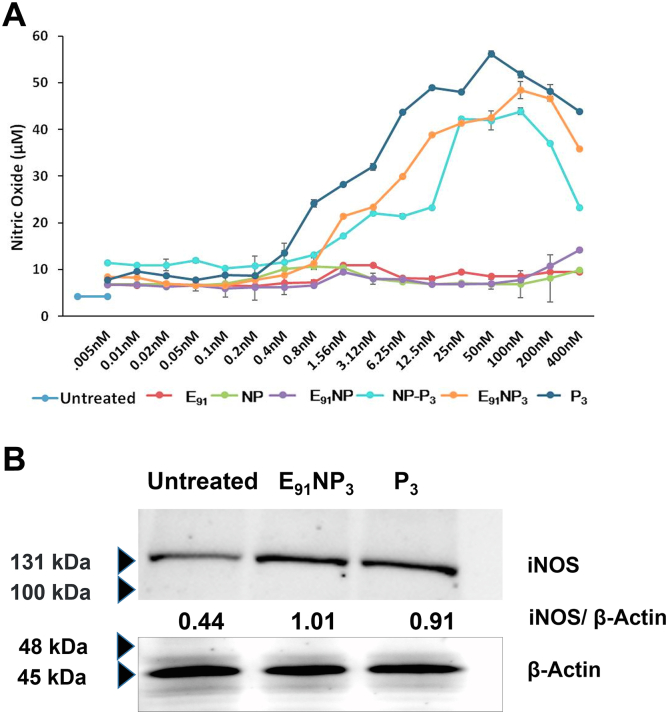
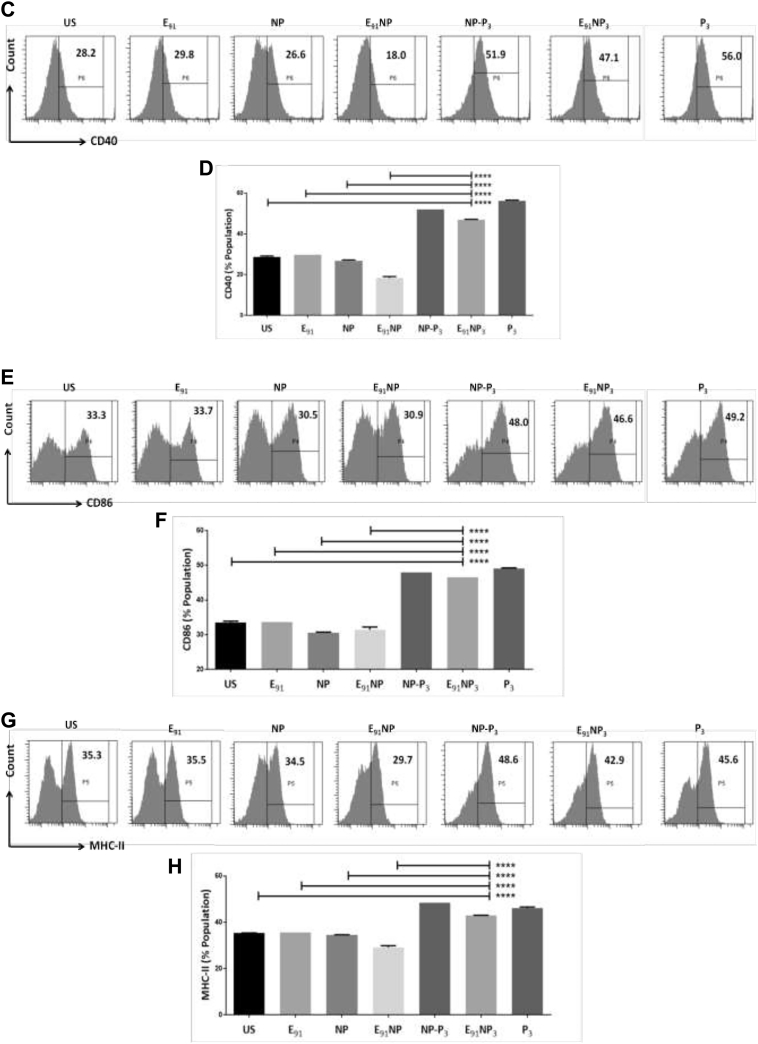
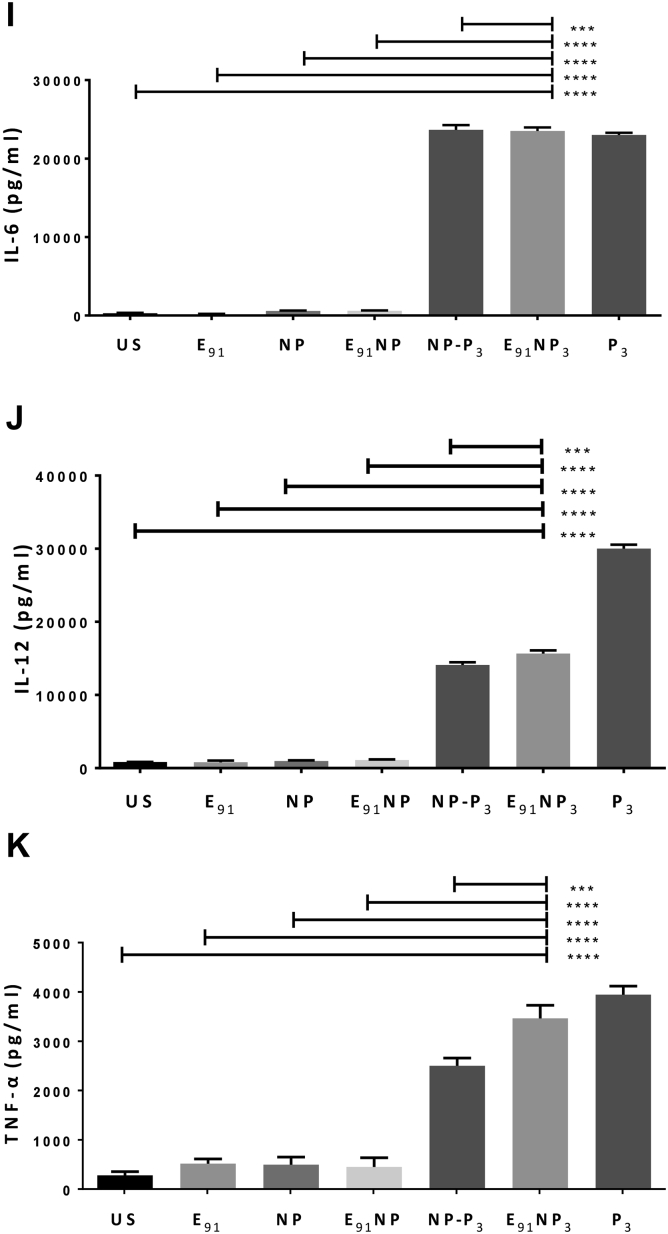
Figure 4.
E91NP3induces robust activationofDCs. The DCs were cultured with E91NP3. Control cultures were set using E91, NP, E91NP, NP-P3, and P3. After 24 h, the cells were used for the expression of CD40, CD86, and MHC II by flow cytometry and SNs for the estimation of NO, IL-6, IL-12, and TNF-α production. A, line plot depicts the dose-dependent release of NO; (B) Western blot experiment was performed using the lysate prepared of the cells harvested at 5 to 6 h post-treatment. Blot depicts the expression levels of iNOS protein; β-actin was used as a loading control. The surface expression of (C and D) CD40; (E and F) CD86; (G and H) MHC II molecules was done by flow cytometry. D, F, and H, the flow cytometry data have also been expressed as bar diagrams. I–K, bar diagrams indicate the level (nanogram per milliliter) of (I) IL-6, (J) IL-12, and (K) TNFα estimated by ELISA. The data depicted as mean ± SD are representative of two to three independent experiments. ∗∗∗∗p < 0.0001. DC, dendritic cell; IL, interleukin; iNOS, inducible NO synthase; MHC, major histocompatibility complex; NO, nitric oxide; NP, nanoparticle; SN, supernatant; TNF-α, tumor necrosis factor alpha.


