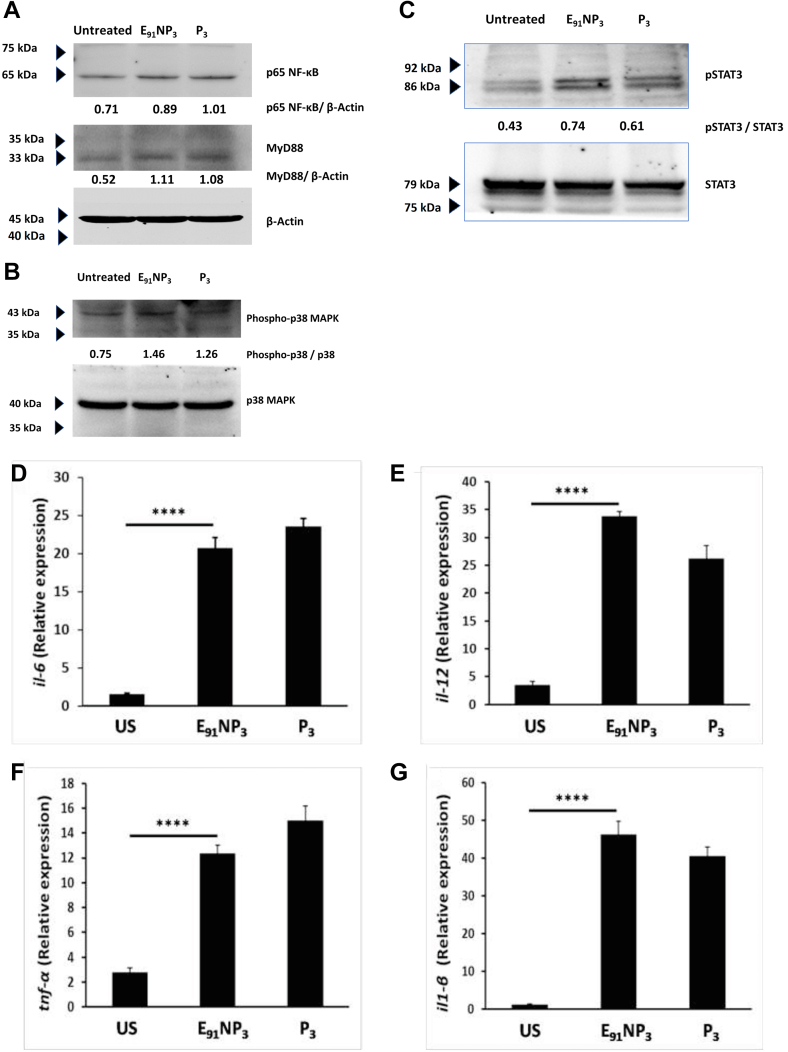
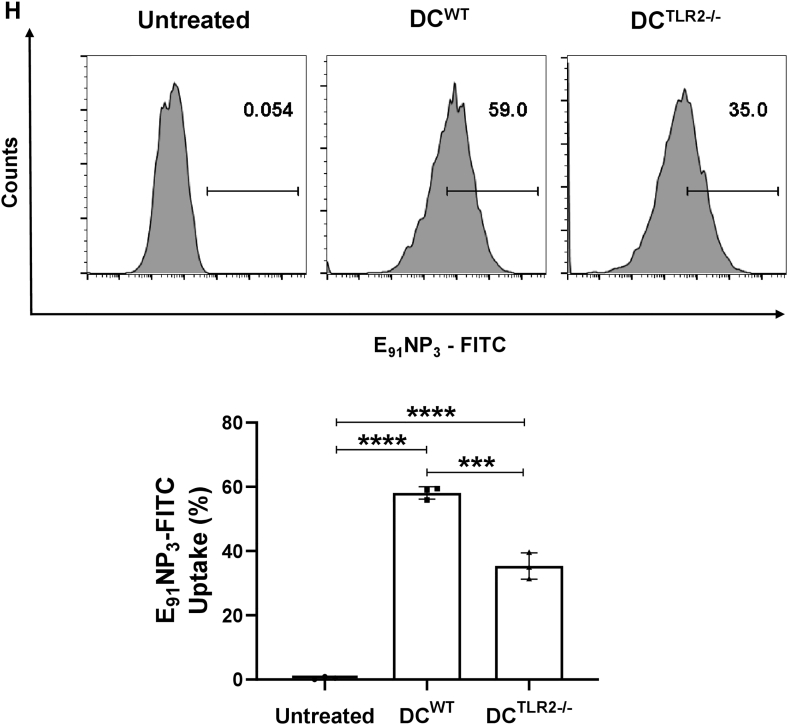
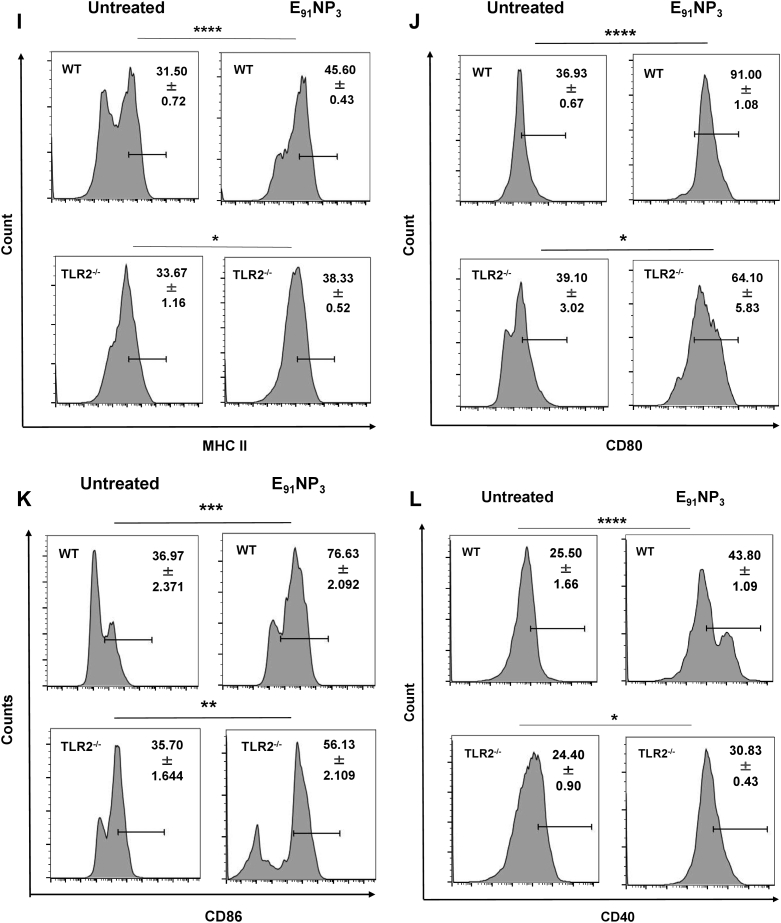
Figure 5.
E91NP3activates DCs through the TLR-2 pathway. The DCs were cultured with E91NP3 and controls (P3, unstimulated DCs). After 5 to 6 h of stimulation, the cell lysate was prepared, and Western blotting was done. Blots depict the level of the expression of (A) p65 (NF-κB) and MyD88, (B) p38 and phospho-p38, and (C) STAT3 and phospho-STAT3 proteins. To check the gene level expression of different cytokines, qRT–PCR was performed using cDNA prepared from RNA isolated from the E91NP3-stimulated DCs and controls. D–G, bar graphs depict the relative expression of (D) il6, (E) il12, (F) tnfα, and (G) il1β genes. H–K, the DCs generated from WT (DCWT) and TLR-2−/− (DCTLR-2−/−) C57BL/6 mice were cultured with FITC-labeled-E91NP3 for 4 h. Later, the cells were monitored for the (H) uptake of FITC-labeled-E91NP3 by the DCWT and DCTLR2−/−; (I–L) expression of MHC II, CD80, CD86, and CD40 by the flow cytometer. The data (mean ± SD) shown are representative of two to three independent experiments. ∗p < 0.05, ∗∗p < 0.01, ∗∗∗p < 0.001, and ∗∗∗∗p < 0.0001. cDNA, complementary DNA; DC, dendritic cell; MHC, major histocompatibility complex; NP, nanoparticle; qRT–PCR, quantitative RT–PCR; TLR-2, toll-like receptor-2.


