Graph 1.

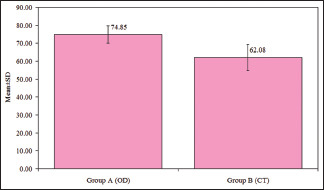
Comparison of overall mean values for primary implant stability between Group A and Group B. Group A: study group (osseodensification technique). Group B: control group (conventional technique)

Comparison of overall mean values for primary implant stability between Group A and Group B. Group A: study group (osseodensification technique). Group B: control group (conventional technique)