Fig. 1.
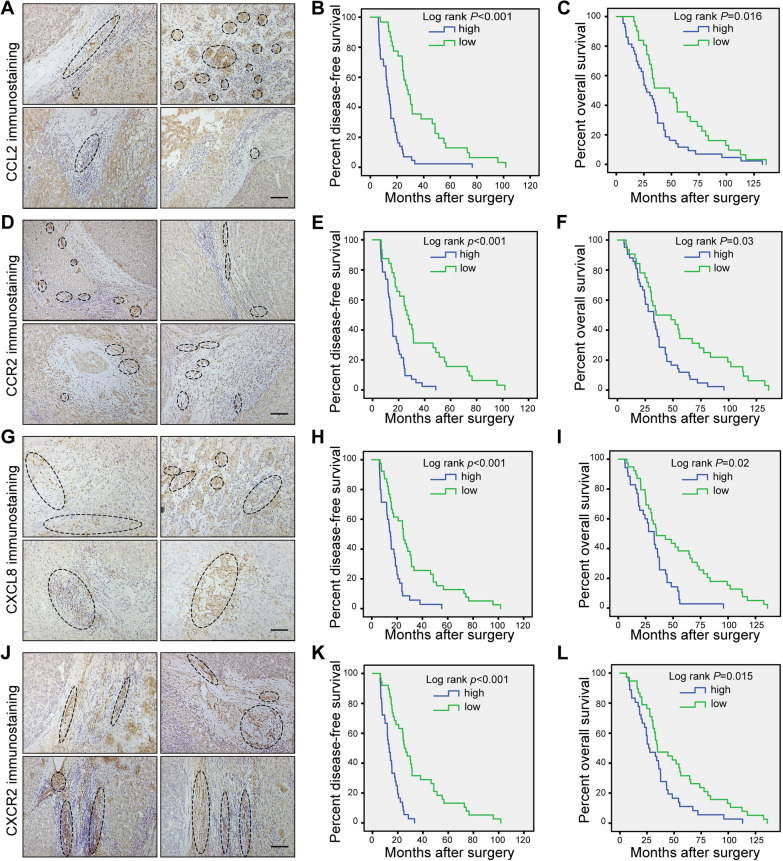
High expression levels of CCL2/CCR2 and CXCL8/CXCR2 in HCC specimens are associated with poor prognosis. Kaplan–Meier estimated of overall survival in 74 patients with HCC according to the expression level of CCL2, CCR2, CXCL8 and CXCR2 in immunohistochemical. Images of five randomly chosen fields per slide were taken with a microscope. Image-Pro Plus 6.2 was employed to analyse the levels of protein expression by calculating the values of mean integrated optical density (integrated optical density/area) for statistical analysis. Patients were divided into low- and high-expression groups by the median of mean integrated optical density. A Four representative images of CCL2 immunostaining in clinical HCC specimens. B, C The Kaplan–Meier curves for disease-free survival (DFS) and overall survival (OS) of this cohort according to low and high expression of CCL2. D Four representative images of CCR2 immunostaining in clinical HCC specimens. E–F Kaplan–Meier curves for DFS and OS according to the expression levels of CCR2. G Four representative images of CXCL8 immunostaining in clinical HCC specimens. H–I Kaplan–Meier DFS and OS curves according to the expression levels of CXCL8. J Four representative images of CXCR2 immunostaining in clinical HCC specimens. K–L Kaplan–Meier DFS and OS curves according to the expression levels of CXCR2. The log-rank p-value for Kaplan–Meier curve is shown on the Kaplan–Meier curve plot. p < 0.05 was considered as statistically significant. Scale bar, 200 μm

