Fig. 1.
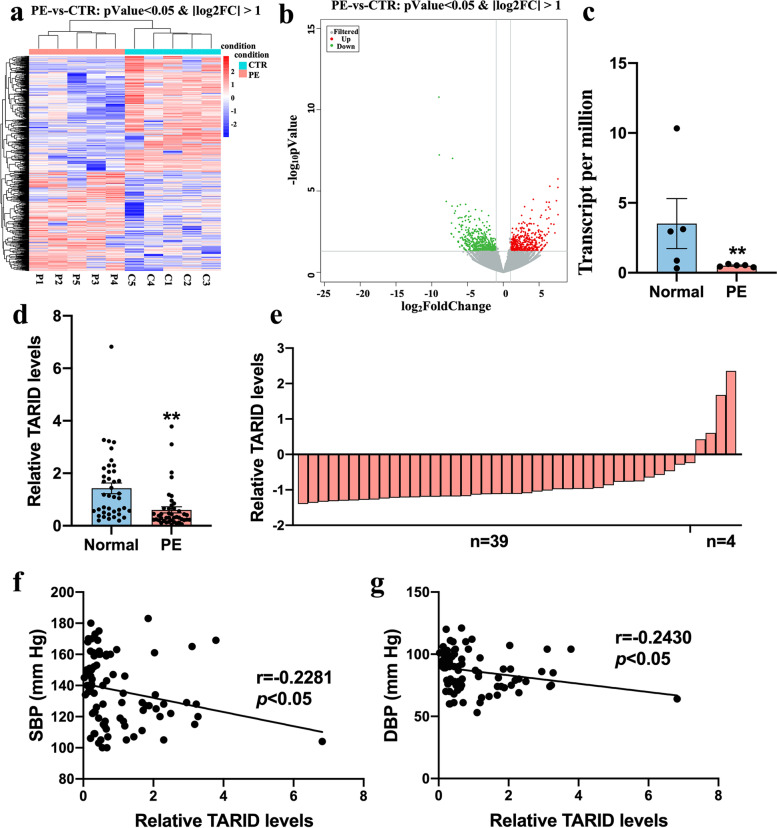
TARID is down regulated in the PE placenta and related to blood pressure. a Differential gene grouping cluster diagram. Red indicates the relatively high expression protein coding gene, and blue indicates the relatively low expression protein coding gene. b Differentially expressed volcanic map. Gray is the gene with a non-significant difference, and red and green are the genes with a significant difference. c TARID expression levels in PE placenta (n = 5) compared with normal placentae (n = 5) by transcriptome profiling. d The relative expression level of TARID was measured by qRT-PCR (Normal = 40, PE = 43). e The expression level of TARID is decreased in 91% (39/43) of PE samples compared with the average level of 40 normal samples. The average expression level in normal samples was set as zero. f Negative correlation (r = − 0.2281) between systolic blood pressure and the relative expression of TARID (Normal = 40, PE = 43) (Pearson correlation analysis). g Negative correlation (r = − 0.2430) between diastolic blood pressure and the relative expression of TARID (Normal = 40, PE = 43) (Pearson correlation analysis). All experiments were conducted in triplicate; the values are shown as the mean ± SEM; vs. normal, **P < 0.01, *P < 0.05

