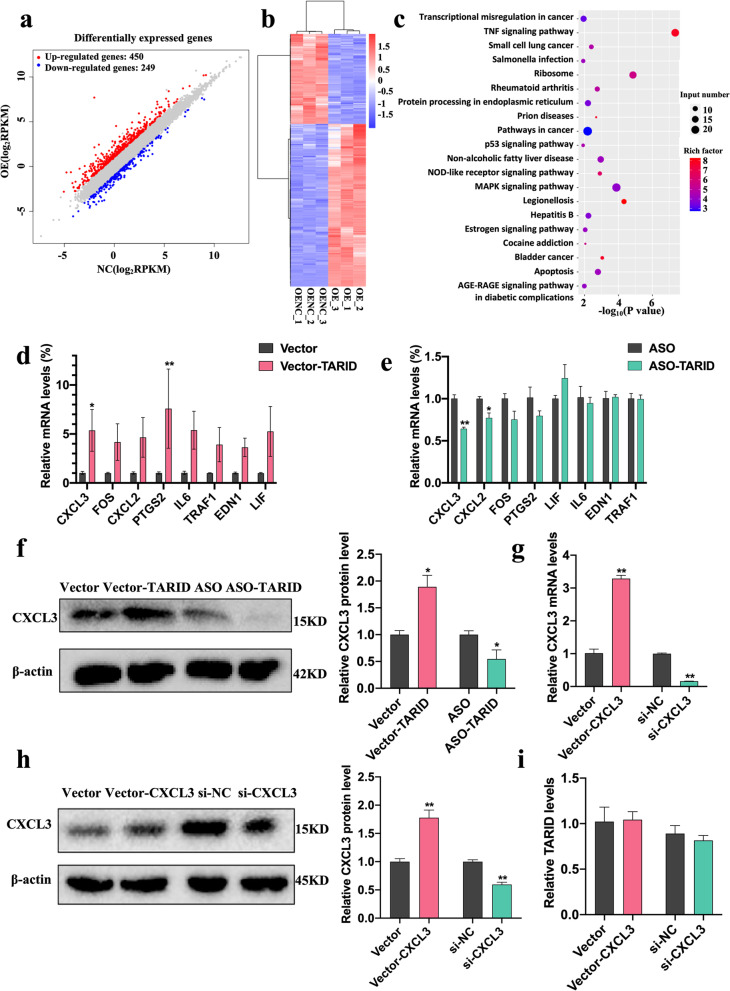
Fig. 5.
CXCL3 as a downstream effector of TARID. a Scatter plot comparing expression levels between groups. b Differential gene cluster map. c KEGG metabolic pathway map of up-regulated genes. d, e The transcription level of TARID target genes in HTR8/SVneo cells with TARID overexpression (d) and knockdown (e). f Western blotting results for CXCL3 in HTR8/SVneo cells with TARID overexpression and knockdown. g, h Results of real-time quantitative PCR (g) and western blotting (h) showing the expression of CXCL3 in HTR8/Svneo cells transiently transfected with vector-CXCL3 or vector and si-CXCL3 or si-NC. i Results of real-time quantitative PCR showing the expression of TARID in HTR8/Svneo cells transiently transfected with vector-CXCL3 or vector and si-CXCL3 or si-NC. All experiments were conducted in triplicate; the values are shown as the mean ± SEM; vs. vector or ASO,**P < 0.01, *P < 0.05

