Fig. 7.
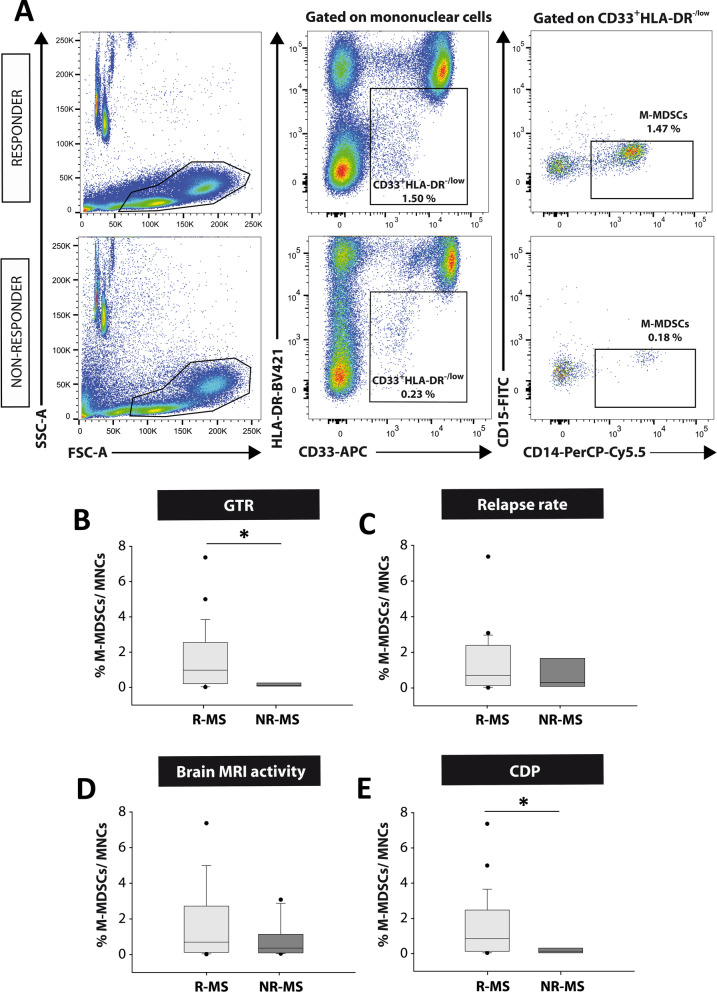
M-MDSCs are more abundant at baseline in patients with a good therapeutic response to fingolimod. A Flow cytometry strategy of analysis for M-MDSCs in human PBMC samples. In both “responder” and “non-responder” MS patients, immature myeloid cells were gated from mononuclear subpopulation as CD33+HLA-DR−/low populations. CD33+HLA-DR−/low cells were assessed for CD14 and CD15 expression to identify the M-MDSC subset defined as CD14+CD15−. B M-MDSCs were more abundant in R-MS patients (those who meet two or more criteria for NEDA-3: good therapeutic response—GTR) than NR-MS patients. C, D M-MDSCs were similar between R-MS and NR-MS patients according the absence of new relapses (C), or new T2 lesions or Gd+ enhancing lesions in MRI after 12 months of treatment (D). E M-MDSCs were clearly higher in patients with stable disability 12 months after fingolimod treatment. R-MS “Responder”-MS patients; NR-MS “non-responder”-MS patients. B R-MS N = 25, NR-MS N = 6; in C R-MS N = 23, NR-MS N = 8; in D R-MS N = 19, NR-MS N = 12; in E R-MS N = 26, NR-MS N = 5

